Answered step by step
Verified Expert Solution
Question
1 Approved Answer
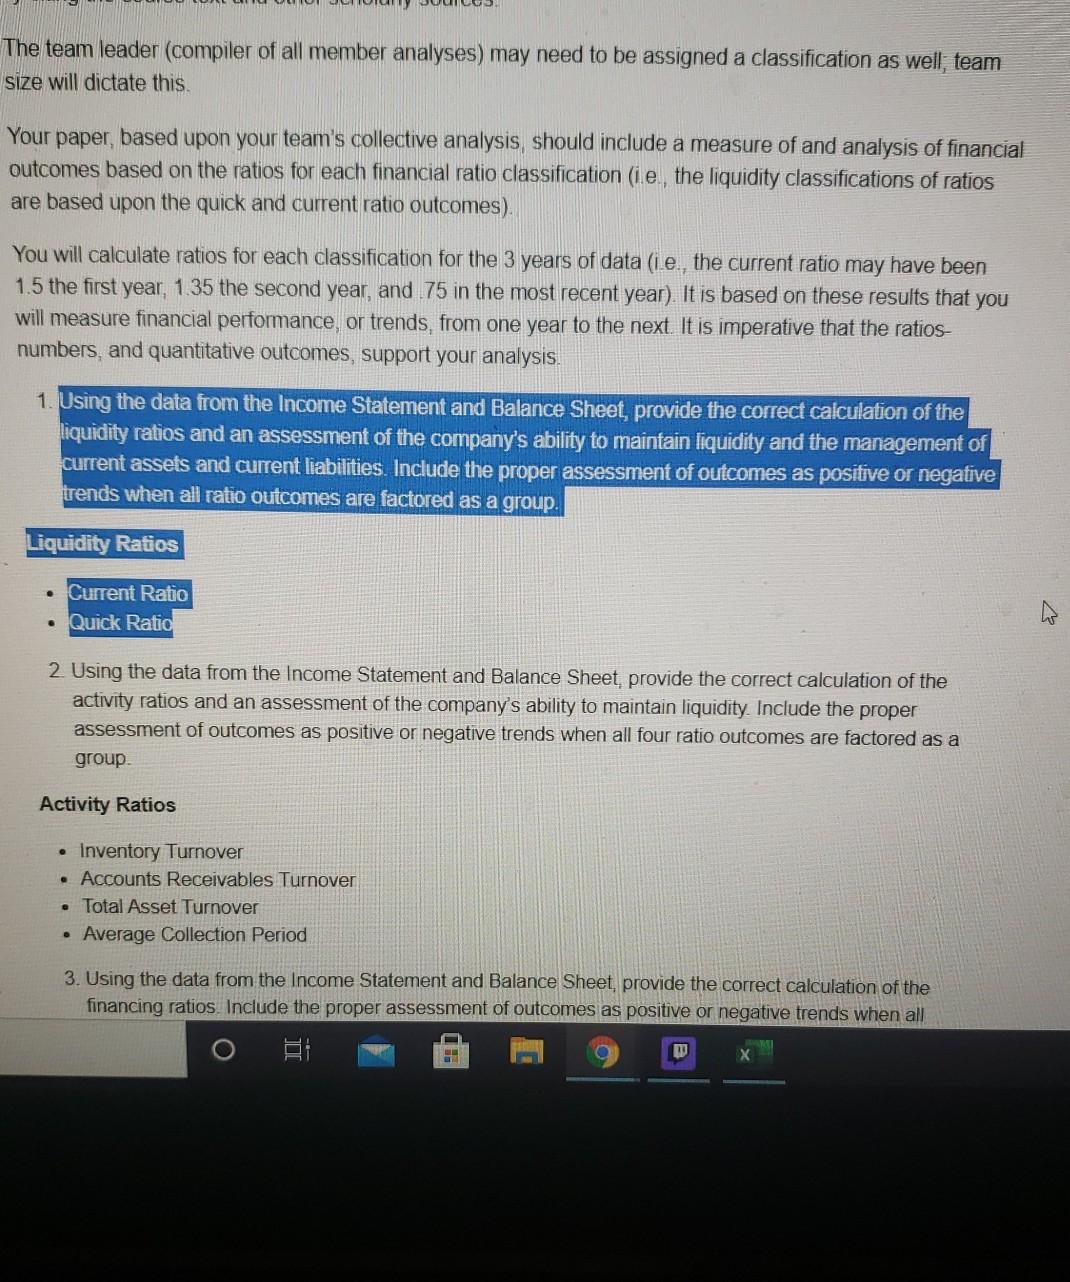
just the highlighted portion please The team leader (compiler of all member analyses) may need to be assigned a classification as well team size will


just the highlighted portion please
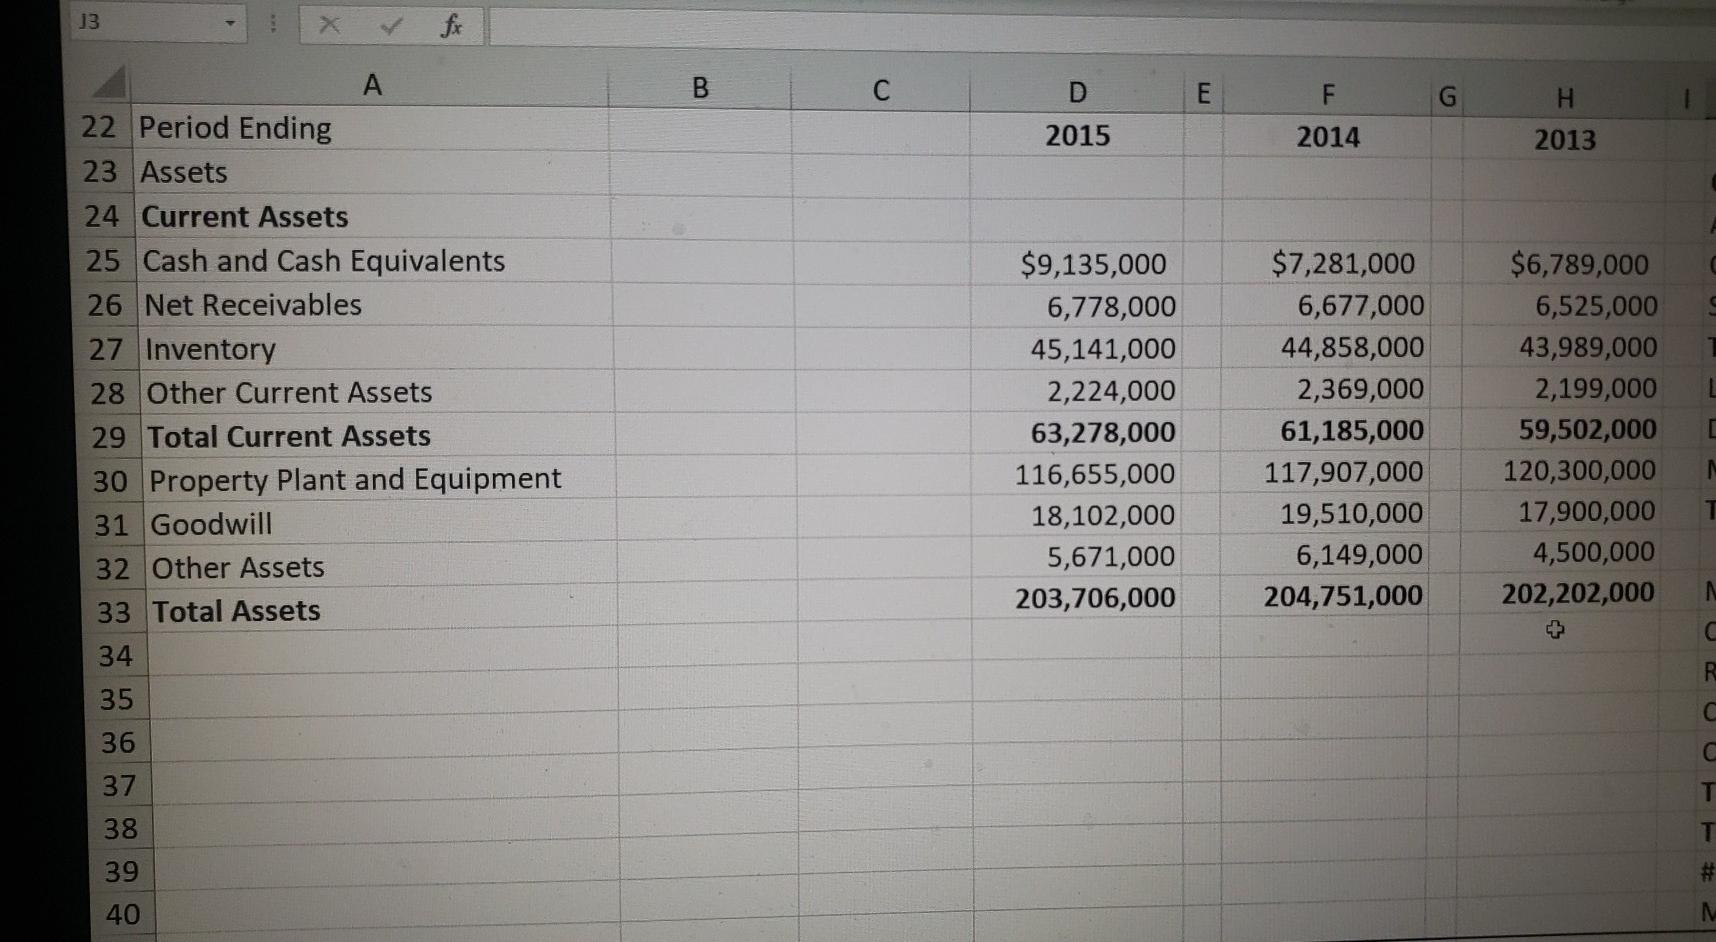
The team leader (compiler of all member analyses) may need to be assigned a classification as well team size will dictate this. Your paper, based upon your team's collective analysis should include a measure of and analysis of financial outcomes based on the ratios for each financial ratio classification (ie, the liquidity classifications of ratios are based upon the quick and current ratio outcomes). You will calculate ratios for each classification for the 3 years of data (ie., the current ratio may have been 1.5 the first year, 135 the second year, and 75 in the most recent year). It is based on these results that you will measure financial performance, or trends, from one year to the next. It is imperative that the ratios- numbers, and quantitative outcomes, support your analysis. 1. Using the data from the Income Statement and Balance Sheet, provide the correct calculation of the liquidity ratios and an assessment of the company's ability to maintain liquidity and the management of current assets and current liabilities. Include the proper assessment of outcomes as positive or negative trends when all ratio outcomes are factored as a group. Liquidity Ratios Current Ratio Quick Ratio 2. Using the data from the Income Statement and Balance Sheet, provide the correct calculation of the activity ratios and an assessment of the company's ability to maintain liquidity. Include the proper assessment of outcomes as positive or negative trends when all four ratio outcomes are factored as a group Activity Ratios Inventory Turnover Accounts Receivables Turnover Total Asset Turnover Average Collection Period 3. Using the data from the Income Statement and Balance Sheet, provide the correct calculation of the financing ratios. Include the proper assessment of outcomes as positive or negative trends when all 13 B E F G H 2015 2014 2013 A 22 Period Ending 23 Assets 24 Current Assets 25 Cash and Cash Equivalents 26 Net Receivables 27 Inventory 28 Other Current Assets 29 Total Current Assets 30 Property Plant and Equipment 31 Goodwill 32 Other Assets 33 Total Assets 34 35 $9,135,000 6,778,000 45,141,000 2,224,000 63,278,000 116,655,000 18,102,000 5,671,000 203,706,000 $7,281,000 6,677,000 44,858,000 2,369,000 61,185,000 117,907,000 19,510,000 6,149,000 204,751,000 $6,789,000 6,525,000 43,989,000 2,199,000 59,502,000 120,300,000 17,900,000 4,500,000 202,202,000 1 N C C C 36 37 T T 38 39 # 40 M The team leader (compiler of all member analyses) may need to be assigned a classification as well team size will dictate this. Your paper, based upon your team's collective analysis should include a measure of and analysis of financial outcomes based on the ratios for each financial ratio classification (ie, the liquidity classifications of ratios are based upon the quick and current ratio outcomes). You will calculate ratios for each classification for the 3 years of data (ie., the current ratio may have been 1.5 the first year, 135 the second year, and 75 in the most recent year). It is based on these results that you will measure financial performance, or trends, from one year to the next. It is imperative that the ratios- numbers, and quantitative outcomes, support your analysis. 1. Using the data from the Income Statement and Balance Sheet, provide the correct calculation of the liquidity ratios and an assessment of the company's ability to maintain liquidity and the management of current assets and current liabilities. Include the proper assessment of outcomes as positive or negative trends when all ratio outcomes are factored as a group. Liquidity Ratios Current Ratio Quick Ratio 2. Using the data from the Income Statement and Balance Sheet, provide the correct calculation of the activity ratios and an assessment of the company's ability to maintain liquidity. Include the proper assessment of outcomes as positive or negative trends when all four ratio outcomes are factored as a group Activity Ratios Inventory Turnover Accounts Receivables Turnover Total Asset Turnover Average Collection Period 3. Using the data from the Income Statement and Balance Sheet, provide the correct calculation of the financing ratios. Include the proper assessment of outcomes as positive or negative trends when all 13 B E F G H 2015 2014 2013 A 22 Period Ending 23 Assets 24 Current Assets 25 Cash and Cash Equivalents 26 Net Receivables 27 Inventory 28 Other Current Assets 29 Total Current Assets 30 Property Plant and Equipment 31 Goodwill 32 Other Assets 33 Total Assets 34 35 $9,135,000 6,778,000 45,141,000 2,224,000 63,278,000 116,655,000 18,102,000 5,671,000 203,706,000 $7,281,000 6,677,000 44,858,000 2,369,000 61,185,000 117,907,000 19,510,000 6,149,000 204,751,000 $6,789,000 6,525,000 43,989,000 2,199,000 59,502,000 120,300,000 17,900,000 4,500,000 202,202,000 1 N C C C 36 37 T T 38 39 # 40 MStep by Step Solution
There are 3 Steps involved in it
Step: 1

Get Instant Access to Expert-Tailored Solutions
See step-by-step solutions with expert insights and AI powered tools for academic success
Step: 2

Step: 3

Ace Your Homework with AI
Get the answers you need in no time with our AI-driven, step-by-step assistance
Get Started


