Answered step by step
Verified Expert Solution
Question
1 Approved Answer
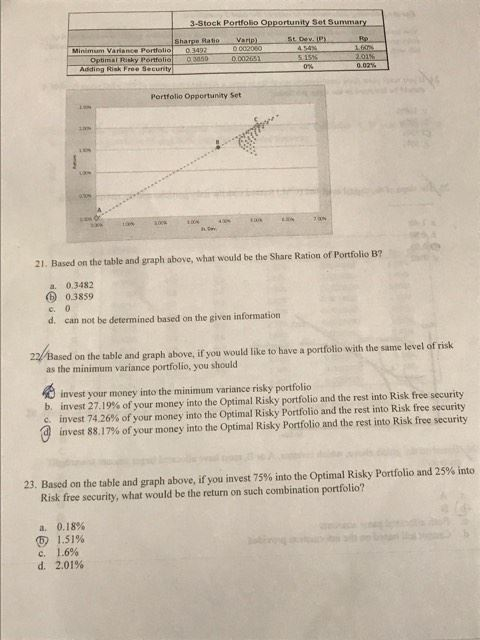
Just want an explanation of why those are the answers. Based on the table and graph above, what would be the Share Ration of Portfolio

Just want an explanation of why those are the answers.
Based on the table and graph above, what would be the Share Ration of Portfolio B? 0.3482 0.3859 0 can not be determined based on the given information Based on the table and graph above, if you would like to have a portfolio with the same level of risk as the minimum variance portfolio, you should invest your money into the minimum variance risky portfolio invest 27.1 19% of your money into the Optimal Risky portfolio and the rest into Risk free security invest 74.26% of your money into the Optimal Risky portfolio and the rest into Risk free security invest 88.17% of your money into the Optimal Risky portfolio and the rest into Risk free security Based on the table and graph above, if you invest 75% into the Optimal Risky Portfolio and 25% into Risk free security, what would be the return on such combination portfolio? 0.18% 1.51 % 1.6 % 2.01 %Step by Step Solution
There are 3 Steps involved in it
Step: 1

Get Instant Access to Expert-Tailored Solutions
See step-by-step solutions with expert insights and AI powered tools for academic success
Step: 2

Step: 3

Ace Your Homework with AI
Get the answers you need in no time with our AI-driven, step-by-step assistance
Get Started


