

Answered step by step
Verified Expert Solution
Question
1 Approved Answer
Just wondering how these two charts get filled in . Below is an example of a chart I did that I know is correct. This
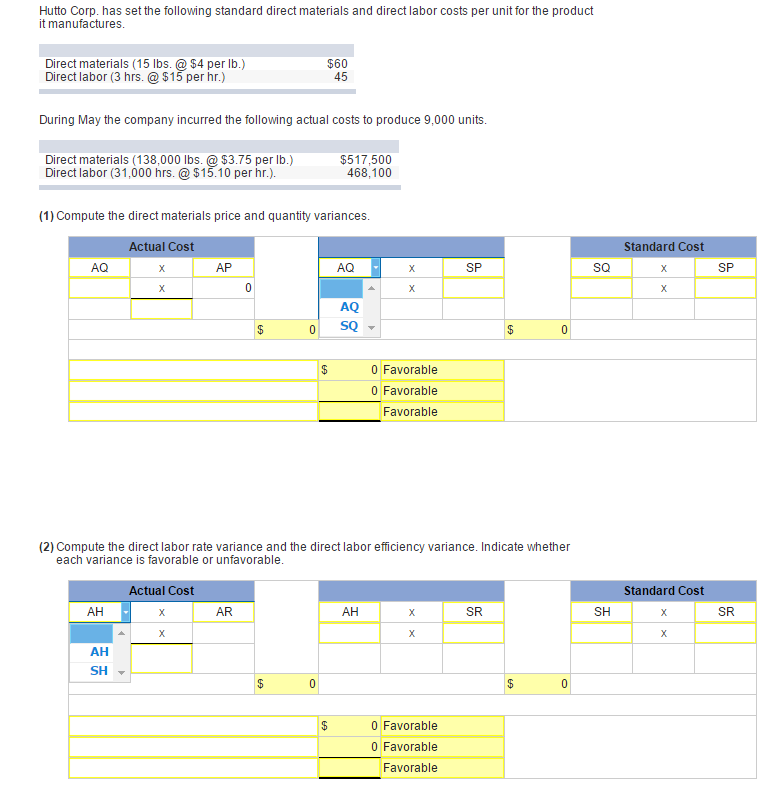
Just wondering how these two charts get filled in .
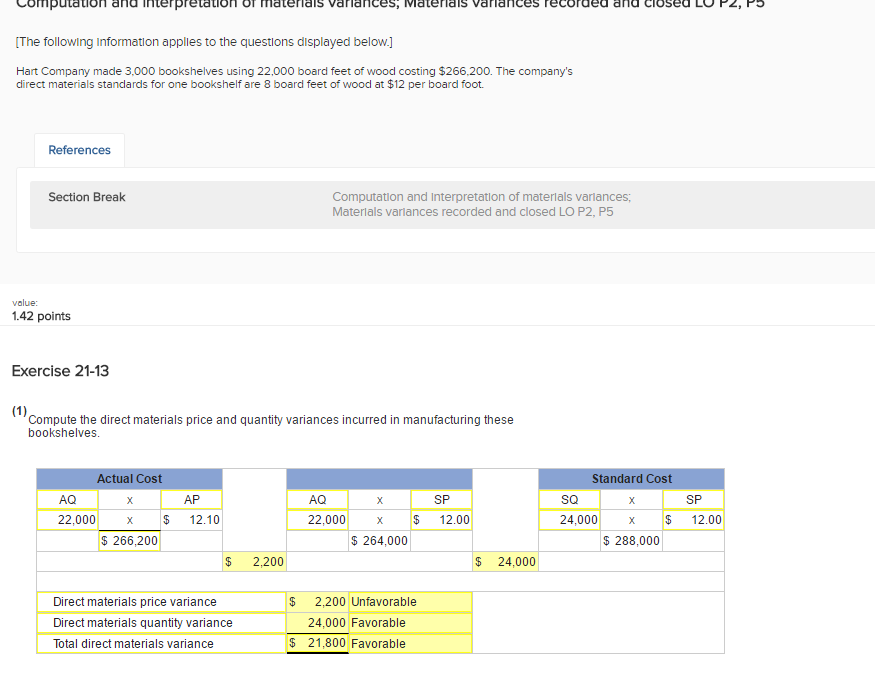
Below is an example of a chart I did that I know is correct. This may help you solve the question with the two graphs above easier.
Step by Step Solution
There are 3 Steps involved in it
Step: 1

Get Instant Access to Expert-Tailored Solutions
See step-by-step solutions with expert insights and AI powered tools for academic success
Step: 2

Step: 3
Ace Your Homework with AI
Get the answers you need in no time with our AI-driven, step-by-step assistance
Get Started
Strategies For Small Audit Shops
Authors: David O'Regan
2nd Edition
0894134701, 978-0894134708