

Answered step by step
Verified Expert Solution
Question
1 Approved Answer
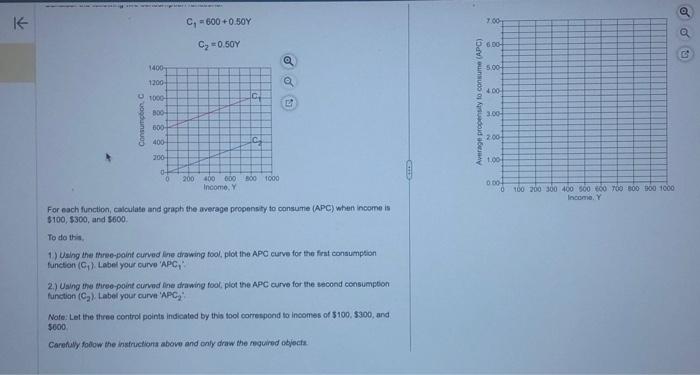
K 55115 ng Consumption, C 1400- 1200- 1000- 800- 600- 400- 200- 0- FESTIVA C = 600 +0.50Y C = 0.50Y 0 200 IC Cg
K 55115 ng Consumption, C 1400- 1200- 1000- 800- 600- 400- 200- 0- FESTIVA C = 600 +0.50Y C = 0.50Y 0 200 IC Cg 400 600 800 1000 Income, Y Q Q For each function, calculate and graph the average propensity to consume (APC) when income is $100, $300, and $600. To do this, 1.) Using the three-point curved line drawing tool, plot the APC curve for the first consumption function (C). Label your curve 'APC'. 2.) Using the three-point curved line drawing tool, plot the APC curve for the second consumption function (C). Label your curve 'APC'. Note: Let the three control points indicated by this tool correspond to incomes of $100, $300, and $600. Carefully follow the instructions above and only draw the required objects. Average propensity to consume (APC) 7.00T 6.00- 5.00- 4.00- 3.00- 2.00- 1.00- 0.00- to 100 200 300 400 500 600 700 800 900 1000 Income, Y
Step by Step Solution
There are 3 Steps involved in it
Step: 1

Get Instant Access to Expert-Tailored Solutions
See step-by-step solutions with expert insights and AI powered tools for academic success
Step: 2

Step: 3
Ace Your Homework with AI
Get the answers you need in no time with our AI-driven, step-by-step assistance
Get Started
Managerial Accounting Tools For Business Decision Making
Authors: Strayer University
2010th Custom Edition
0470603534, 978-0470603536