

Answered step by step
Verified Expert Solution
Question
1 Approved Answer
K Clayton Kershaw of the Los Angeles Dodgers is one of the premier pitchers in baseball. His most popular pitch is a four-seam fastball.
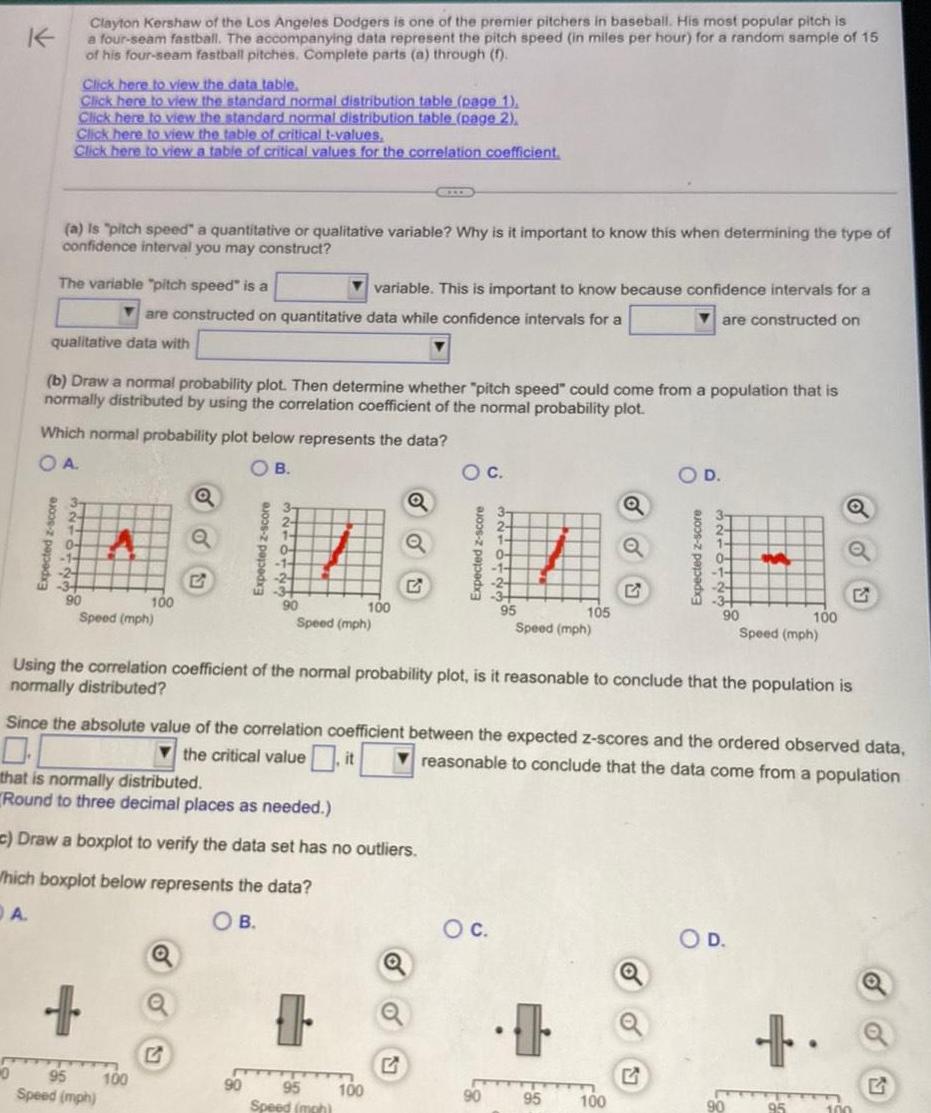
K Clayton Kershaw of the Los Angeles Dodgers is one of the premier pitchers in baseball. His most popular pitch is a four-seam fastball. The accompanying data represent the pitch speed (in miles per hour) for a random sample of 15 of his four-seam fastball pitches. Complete parts (a) through (f). Click here to view the data table. Click here to view the standard normal distribution table (page 1), Click here to view the standard normal distribution table (page 2) Click here to view the table of critical t-values, Click here to view a table of critical values for the correlation coefficient. (a) Is "pitch speed" a quantitative or qualitative variable? Why is it important to know this when determining the type of confidence interval you may construct? The variable "pitch speed" is a variable. This is important to know because confidence intervals for a are constructed on quantitative data while confidence intervals for a are constructed on qualitative data with (b) Draw a normal probability plot. Then determine whether "pitch speed" could come from a population that is normally distributed by using the correlation coefficient of the normal probability plot. Which normal probability plot below represents the data? OA. OB. C. O D. Q a Q A a a 0- 0- -1- -24 -2- G -2- G -2- G -3+ 90 100 Speed (mph) 90 100 95 105 90 100 Speed (mph) Speed (mph) Speed (mph) Using the correlation coefficient of the normal probability plot, is it reasonable to conclude that the population is normally distributed? Since the absolute value of the correlation coefficient between the expected z-scores and the ordered observed data, the critical value it that is normally distributed. Round to three decimal places as needed.) c) Draw a boxplot to verify the data set has no outliers. Which boxplot below represents the data? reasonable to conclude that the data come from a population A OB. Q + 95 Speed (mph) 100 a G 95 Speed (mph) 100 a G C. D. 90 95 100 G 90 100 G
Step by Step Solution
There are 3 Steps involved in it
Step: 1

Get Instant Access to Expert-Tailored Solutions
See step-by-step solutions with expert insights and AI powered tools for academic success
Step: 2

Step: 3
Ace Your Homework with AI
Get the answers you need in no time with our AI-driven, step-by-step assistance
Get Started
Elementary And Intermediate Algebra Concepts And Applications
Authors: Marvin L. Bittinger, David J. Ellenbogen, Barbara L. Johnson
5th Edition
0321559444, 9780321559449