

Answered step by step
Verified Expert Solution
Question
1 Approved Answer
Use the probability distribution or histogram to find the (a) mean, (b) variance, (c) standard deviation, and (d) expected value of the probability distribution,
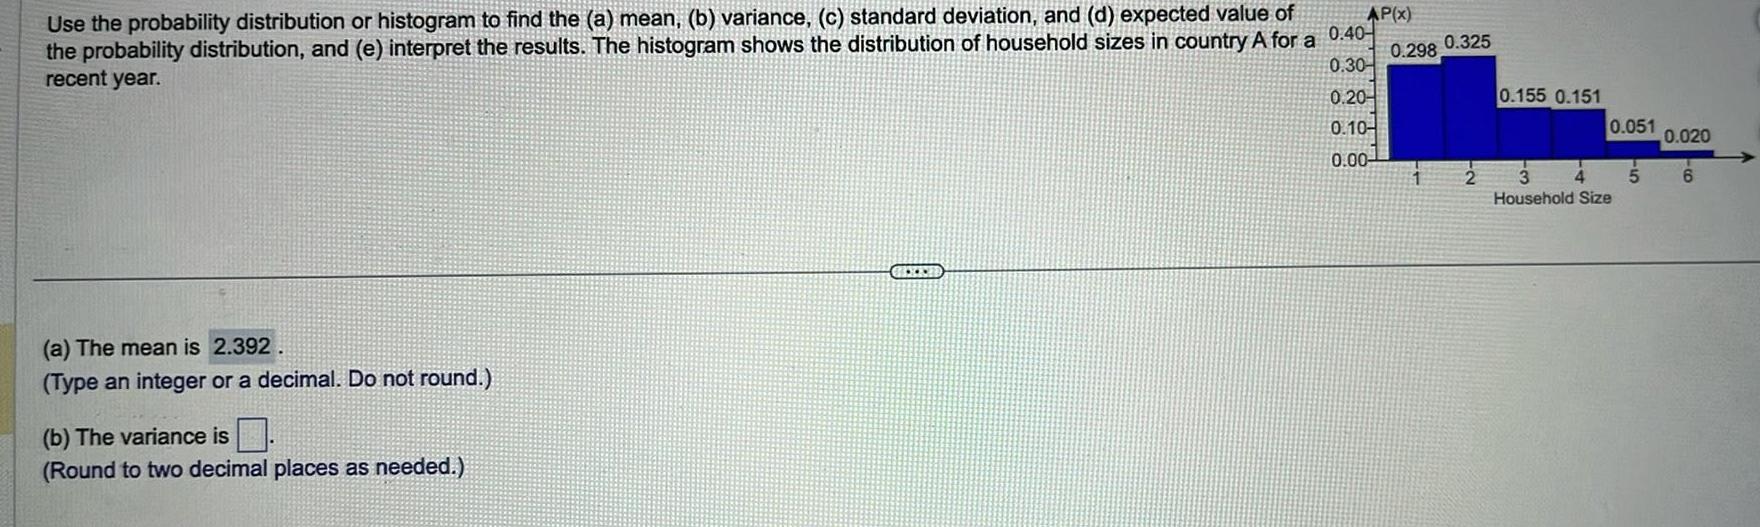
Use the probability distribution or histogram to find the (a) mean, (b) variance, (c) standard deviation, and (d) expected value of the probability distribution, and (e) interpret the results. The histogram shows the distribution of household sizes in country A for a 0.40 recent year. (a) The mean is 2.392. (Type an integer or a decimal. Do not round.) (b) The variance is (Round to two decimal places as needed.) AP(x) 0.325 0.298, 0.30 0.20- 0.155 0.151 0.10- 0.051 0.020 0.00- -2 3 5 6 Household Size
Step by Step Solution
There are 3 Steps involved in it
Step: 1

Get Instant Access to Expert-Tailored Solutions
See step-by-step solutions with expert insights and AI powered tools for academic success
Step: 2

Step: 3
Ace Your Homework with AI
Get the answers you need in no time with our AI-driven, step-by-step assistance
Get Started
Elementary And Intermediate Algebra Concepts And Applications
Authors: Marvin L. Bittinger, David J. Ellenbogen, Barbara L. Johnson
5th Edition
0321559444, 9780321559449