

Answered step by step
Verified Expert Solution
Question
1 Approved Answer
K The accompanying data represent the monthly rate of return of a certain company's common stock for the past few years. Complete parts (a)
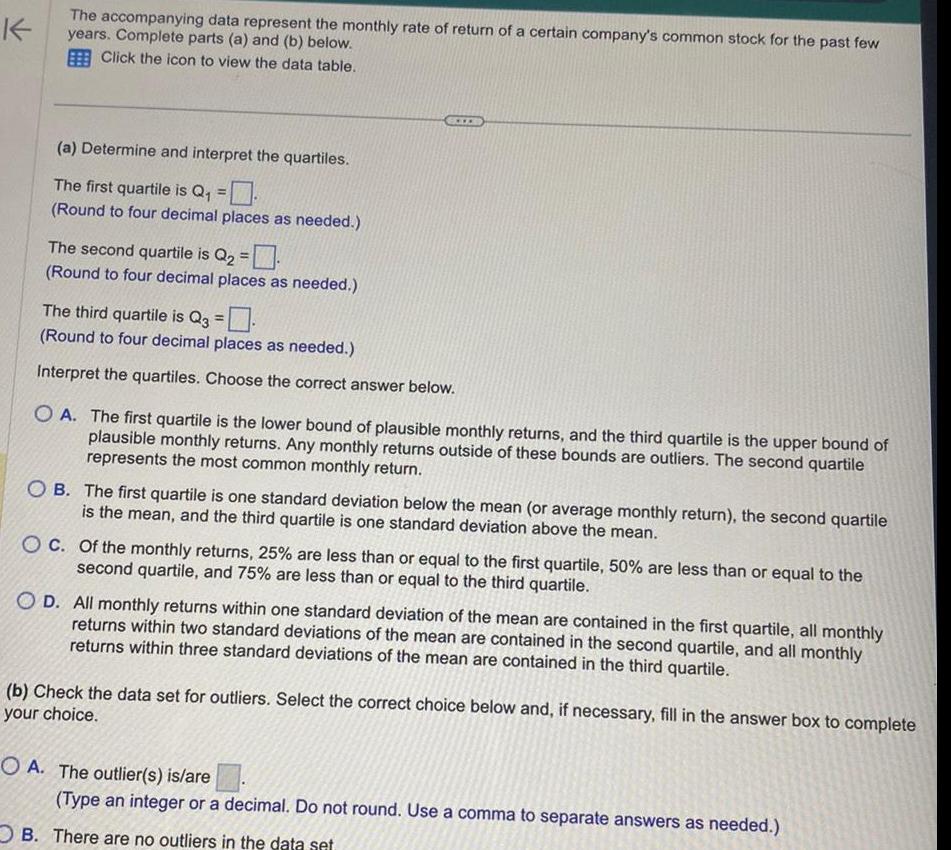
K The accompanying data represent the monthly rate of return of a certain company's common stock for the past few years. Complete parts (a) and (b) below. Click the icon to view the data table. (a) Determine and interpret the quartiles. The first quartile is Q = (Round to four decimal places as needed.) The second quartile is Q = (Round to four decimal places as needed.) The third quartile is Q3 = (Round to four decimal places as needed.) Interpret the quartiles. Choose the correct answer below. OA. The first quartile is the lower bound of plausible monthly returns, and the third quartile is the upper bound of plausible monthly returns. Any monthly returns outside of these bounds are outliers. The second quartile represents the most common monthly return. OB. The first quartile is one standard deviation below the mean (or average monthly return), the second quartile is the mean, and the third quartile is one standard deviation above the mean. OC. Of the monthly returns, 25% are less than or equal to the first quartile, 50% are less than or equal to the second quartile, and 75% are less than or equal to the third quartile. OD. All monthly returns within one standard deviation of the mean are contained in the first quartile, all monthly returns within two standard deviations of the mean are contained in the second quartile, and all monthly returns within three standard deviations of the mean are contained in the third quartile. (b) Check the data set for outliers. Select the correct choice below and, if necessary, fill in the answer box to complete your choice. OA. The outlier(s) is/are (Type an integer or a decimal. Do not round. Use a comma to separate answers as needed.) B. There are no outliers in the data set
Step by Step Solution
There are 3 Steps involved in it
Step: 1

Get Instant Access to Expert-Tailored Solutions
See step-by-step solutions with expert insights and AI powered tools for academic success
Step: 2

Step: 3
Ace Your Homework with AI
Get the answers you need in no time with our AI-driven, step-by-step assistance
Get Started
Quantitative Methods For Business Management And Finance
Authors: Louise Swift, Sally Piff
2nd Edition
1403935289, 9781403935281