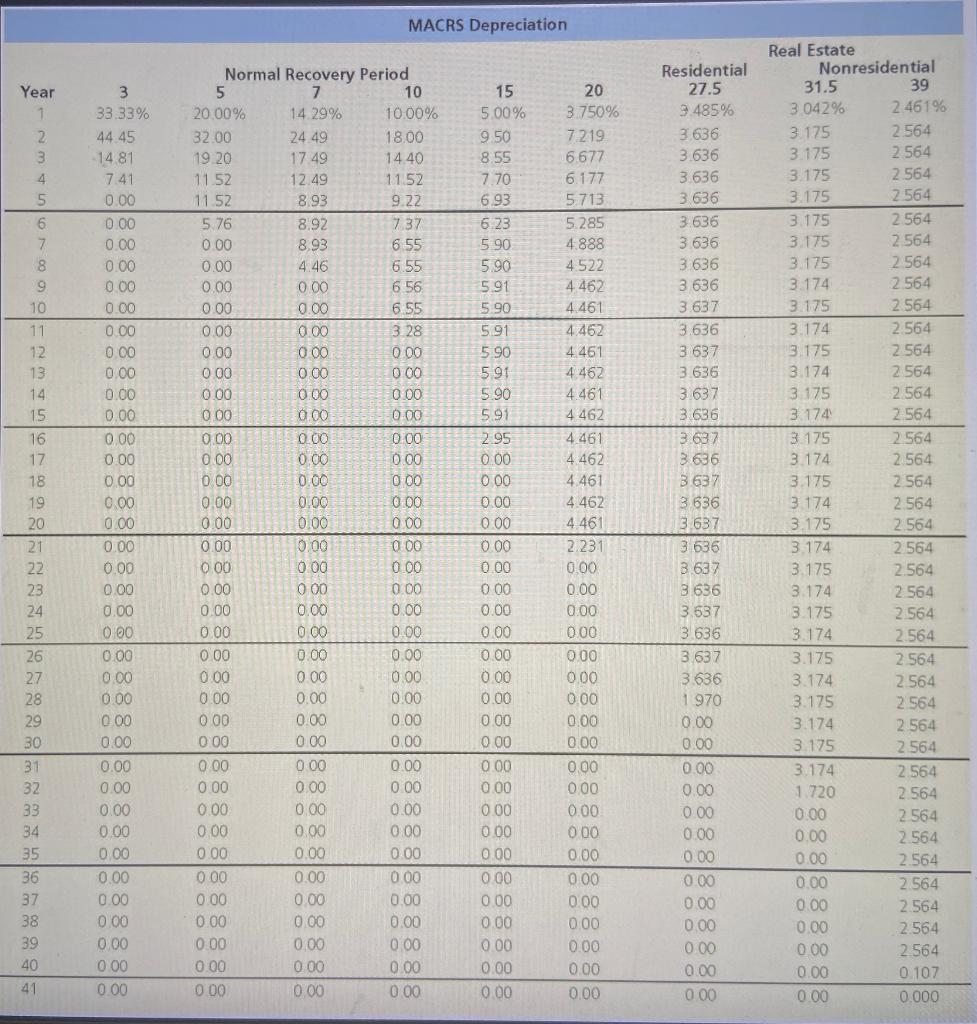
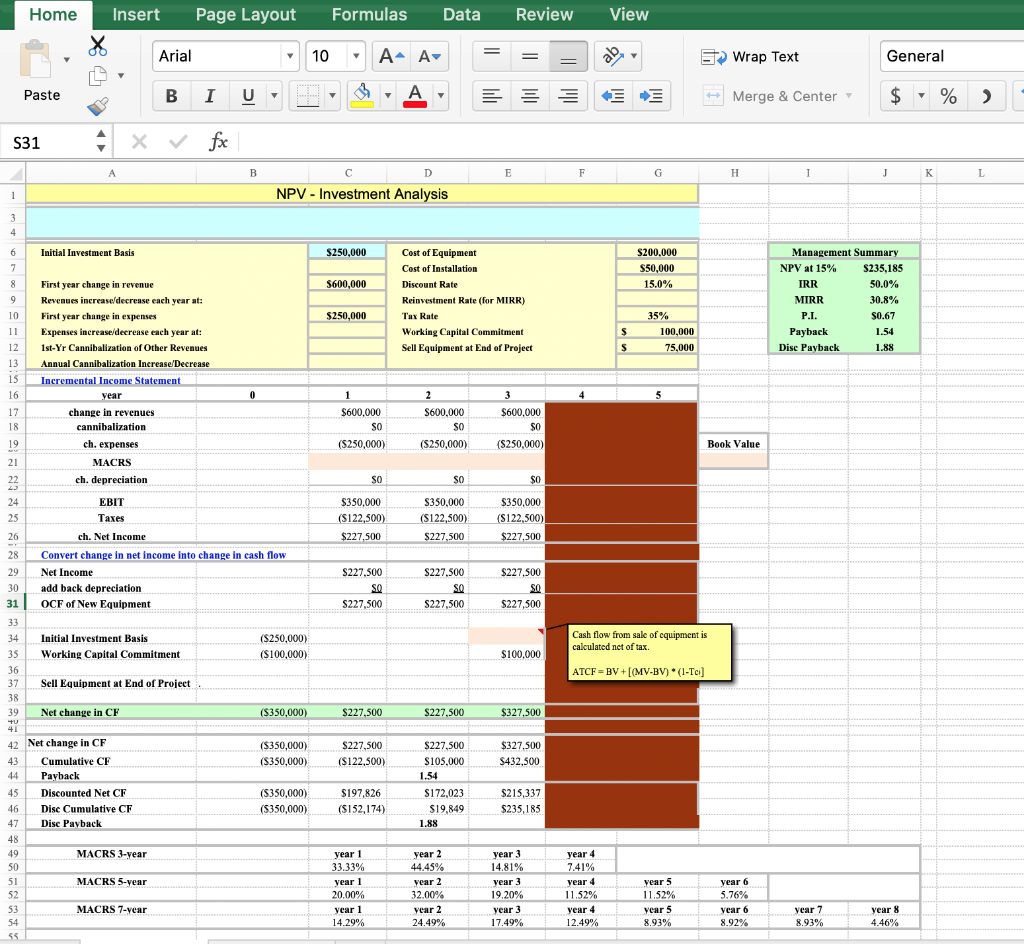
KADS, Inc. has spent $400,000 on research to develop a new computer game. The firm is planning to spend $200,000 on a machine to produce the new game. Shipping and installation costs of the machine will be capitalized and depreciated; they total $50,000. The machine has an expected life of three years, a $75,000 estimated resale value, and falls under the MACRS (Links to an external site.) 7-year class life. Revenue from the new game is expected to be $600,000 per year, with costs of $250,000 per year. The firm has a tax rate of 35 percent, KADS has an opportunity cost of capital of 15 percent, and it expects net working capital to increase by $100,000 at the beginning of the project.
What will the cash flows for this project be?
According to the Management Report, should KADS go forward with the project?


MACRS Depreciation 15 5.00% 9 50 8.55 7.70 6.93 3.175 20 3.750% 7.219 6.677 6.177 5.713 5.285 4.888 4.522 4.462 4.461 4.462 4.461 4.462 4.461 4.462 4.461 4 462 4.461 4.462 3.174 Year 1 2 3 4 5 6 7 8 9 10 11 12 13 14 15 16 17 18 19 20 21 22 23 24 25 26 27 28 29 30 31 32 33 34 35 36 37 38 39 40 4.461 3 33.33% 44 45 -1481 7.41 0.00 0.00 0.00 0.00 0.00 0.00 0.00 0.00 0.00 0.00 0.00 0.00 0.00 0.00 0.00 0.00 0.00 0.00 0.00 0.00 0.00 0.00 0.00 0.00 0.00 0.00 0.00 0.00 0.00 0.00 0.00 0.00 0.00 0.00 0.00 0.00 000 Normal Recovery Period 5 7 10 20.00% 14.29% 10.00% 32.00 24 49 18.00 19 20 17 49 14.40 11.52 12.49 11.52 11.52 8.93 9.22 5.76 8.92 7.37 0.00 8.93 6 55 0.00 4.46 6.55 0.00 000 6.56 0.00 0.00 6.55 0.00 0.00 3 28 000 000 000 000 0 00 000 0.00 0.00 0.00 000 0.00 0.00 0.00 0.00 0 00 0.00 0.00 0.00 0.00 0.00 000 0.00 0.00 0.00 0.00 0.00 000 0.00 0.00 0.00 0.00 0.00 0.00 0.00 000 0.00 0.00 0.00 0.00 0.00 0.00 0.00 0.00 0.00 0.00 0.00 0.00 0.00 0.00 0.00 000 0.00 0.00 000 000 0.00 0.00 0.00 0.00 0.00 0.00 0.00 0.00 0.00 0.00 0.00 0.00 0.00 0.00 0.00 0.00 0.00 0.00 0.00 0.00 0.00 0.00 0.00 0.00 0.00 0.00 0.00 0.00 0.00 0.00 0.00 000 0.00 0.00 6.23 5.90 5.90 5.91 5.90 5.91 590 5.91 5.90 5.91 2.95 0.00 0.00 0.00 0.00 0.00 0.00 000 0.00 000 0.00 0.00 0.00 000 000 000 0.00 000 000 000 0.00 000 000 0.00 0.00 0.00 Residential 27.5 9485% 3.636 3.636 3636 3636 3.636 3.636 3.636 3 636 3.637 3.636 3 637 3.636 3.637 3.636 3.687 3636 3637 3636 3637 3 636 3.637 3636 3.537 3 636 3.637 3.636 1970 0.00 0.00 0.00 0.00 0.00 0.00 0.00 0.00 0.00 0.00 0.00 0.00 000 Real Estate Nonresidential 31.5 39 3042% 2.46196 3.175 2.564 3.175 2564 3.175 2.564 3.175 2564 3.175 2564 2564 3.175 2.564 3 174 2564 3.175 2.564 2.564 3.175 2 564 3.174 2564 3.175 2564 3.174 2564 3 175 2564 3.174 2.564 3.175 2564 3.174 2.564 3.175 2.564 3 174 2.564 3.175 2.564 3.174 2.564 3.175 2.564 3.174 3.175 2564 3.174 2.564 3.175 2 564 3.174 2.564 3.175 2.564 3.174 2564 1.720 2 564 0.00 0.00 2.564 0.00 2.564 0.00 2.564 2.564 0.00 2.564 0.00 2.564 0.00 0.107 0.00 0.000 2.564 000 2.231 000 0.00 0.00 000 0.00 000 0.00 0.00 0.00 0.00 0.00 0.00 000 000 0.00 0.00 0.00 0.00 0.00 0.00 2564 0.00 41 Formulas Data Review View Home Insert Page Layout X Arial 10 A A Wrap Text General Paste B I U 9 A Merge & Center $ % ) S31 fx A B D E F G H I T J K L 1 1 NPV - Investment Analysis 3 4 6 Initial Investment Basis $250,000 7 $200,000 $50,000 15.0% 8 $600,000 9 Cost of Equipment Cost of Installation Discount Rate Reinvestment Rate (for MIRR) Tax Rate Working Capital Commitment Sell Equipment at End of Project Management Summary NPV at 15% $235.185 IRR 50.0% MIRR 30.8% P.I. $0.67 Payback 1.54 Dise Payback 1.88 $250,000 $ 35% 100,000 75,000 S 10 11 12 13 15 16 First year change in revenue Revenues increase/decrease each year at: First year change in expenses Expenses increase/decrease each year at: 1st-Yr Cannibalization of Other Revenues Annual Cannibalization Increase/Decrease .... Incremental Income Statement Year change in revenues cannibalization ch. expenses MACRS ch. depreciation 0 1 2 5 17 $600,000 SO 3 $600.000 SO (S250,000) S600,000 SO (S250,000) 18 (S250,000) Book Value 19 21 22 SO SO SO $350,000 (5122,500) $227,500 S350,000 (5122,500) $227,500 $350,000 (S122,500) $227.500 S227.500 SO S227.500 SO S227,500 $227.500 SO $227,500 S227,500 Cash flow from sale of equipment is calculated net of tax $100,000 ATCFBV + ((MV-BV) *(1-Tc] $227,500 S227,500 $327.500 24 EBIT 25 Taxes 26 ch. Net Income 28 Convert change in net income into change in cash flow 29 Net Income 30 add back depreciation 31 OCF of New Equipment 33 34 Initial Investment Basis (S250,000) 35 Working Capital Commitment ($100,000) 36 37 Sell Equipment at End of Project 38 39 Net change in CF ($350,000) +0 41 42 Net change in CF ($350,000) 43 Cumulative CF (S350,000) 44 Payback 45 Discounted Net CF (5350,000) 46 Disc Cumulative CF (5350,000) 47 Disc Payback 48 49 MACRS 3-year SO 51 MACRS 5-year 52 53 MACRS 7-year 54 55 S227.500 (S122,500) $327,500 S432,500 $227,500 S105,000 1.54 S172,023 $19,849 1.88 $197,826 ($152,174) $215,337 $235,185 year 3 year 1 33.33% year 1 20.00% year 1 14.29% year 2 44.45% year 2 2 32.00% Year 2 24.49% 14.81% year 3 19.20% year 3 17.49% year 4 7.41% year 4 11.52% year 4 Year 5 11.52% Year 5 8.93% Year 6 5.76% year 6 8.92% year 8 year 7 8.93% 12.49% 4.46%


