KARL PEARSON COEFFICIENT AND SEMI AVERAGE
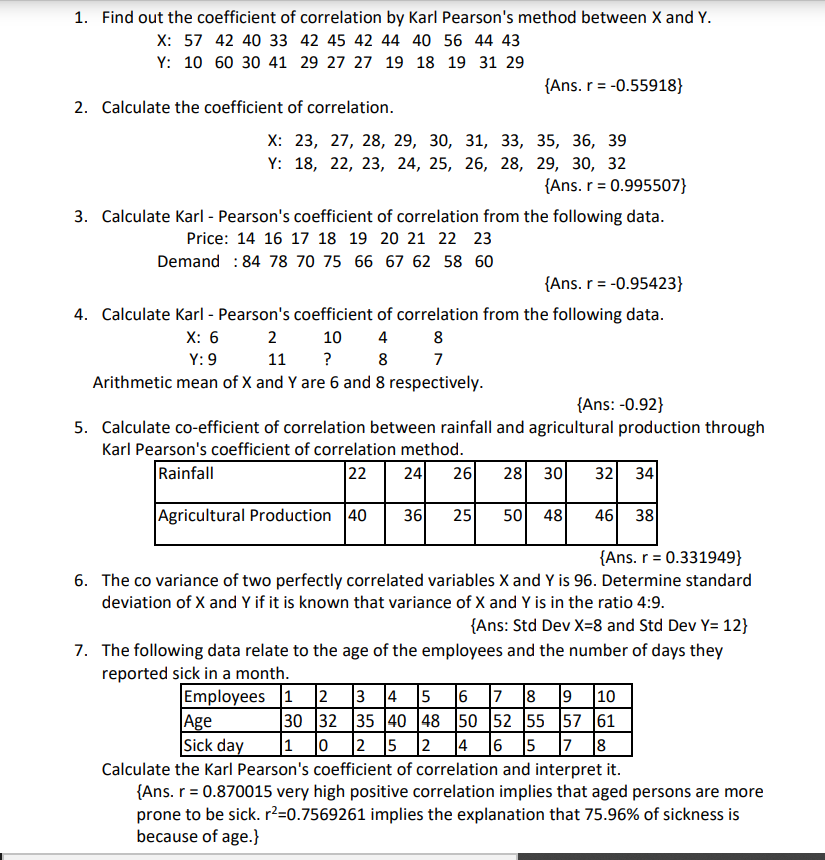
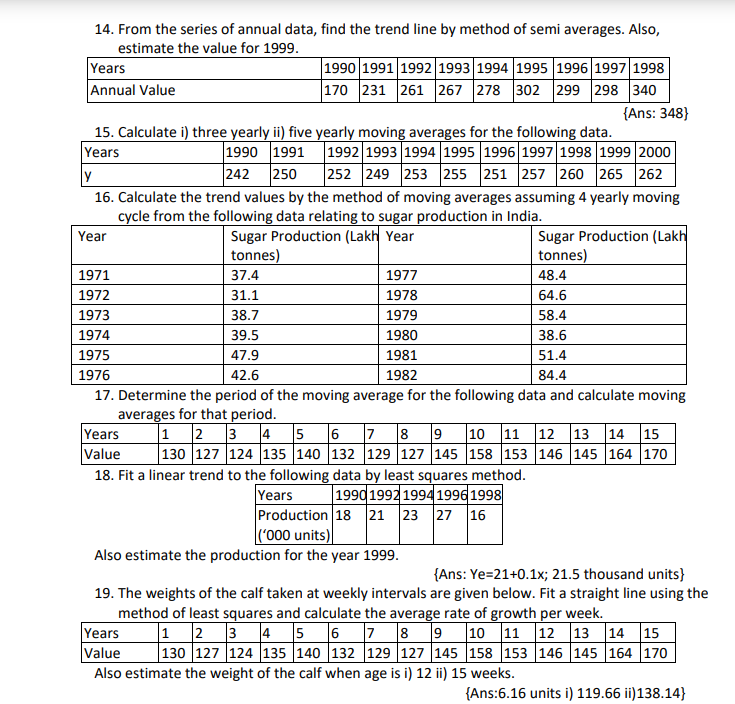
1. Find out the coefficient of correlation by Karl Pearson's method between X and Y. X: 57 42 40 33 42 45 42 44 40 56 44 43 Y: 10 60 30 41 29 27 27 19 18 19 31 29 {Ans. r = -0.55918} 2. Calculate the coefficient of correlation. X: 23, 27, 28, 29, 30, 31, 33, 35, 36, 39 Y: 18, 22, 23, 24, 25, 26, 28, 29, 30, 32 [Ans. r = 0.995507} 3. Calculate Karl - Pearson's coefficient of correlation from the following data. Price: 14 16 17 18 19 20 21 22 23 Demand : 84 78 70 75 66 67 62 58 60 {Ans. r = -0.95423} 4. Calculate Karl - Pearson's coefficient of correlation from the following data. X: 6 2 10 8 Y: 9 11 8 7 Arithmetic mean of X and Y are 6 and 8 respectively. {Ans: -0.92} 5. Calculate co-efficient of correlation between rainfall and agricultural production through Karl Pearson's coefficient of correlation method. Rainfall 22 24 26 28 30 32 34 Agricultural Production 40 36 25 50 48 46 38 {Ans. r = 0.331949} 6. The co variance of two perfectly correlated variables X and Y is 96. Determine standard deviation of X and Y if it is known that variance of X and Y is in the ratio 4:9. {Ans: Std Dev X=8 and Std Dev Y= 12} 7. The following data relate to the age of the employees and the number of days they reported sick in a month. Employees 2 3 14 15 16 8 9 10 Age 30 32 35 40 18 50 152 155 57 61 Sick day 1 12 5 14 16 15 8 Calculate the Karl Pearson's coefficient of correlation and interpret it. Ans. r = 0.870015 very high positive correlation implies that aged persons are more prone to be sick. r2=0.7569261 implies the explanation that 75.96% of sickness is because of age.}14. From the series ofannual data, nd the trend line by method of semi averages. Also, estimate the value for 1999. Years 1990 1991 1992 1993 1994 1995 1995 1992 1998 Annual Value 120 231 251 262 228 302 299 298 340 {Ans: 348} 15. Calculate [1 three vearlv ii} ve vearlv moving averages for the following data. Years 1990 1991 1992 1993 1994 1995 1996 1992 1998 1999 2000 v 242 250 252 249 253 255 251 252 260 255 262 16. Calculate the trend values by the method of moving averages assum ng 4 vearlv moving cycle from the following data relating to sugar production in India. Year Sugar Production [Lakh Year Sugar Production {Lakh tonnes} tonnesi 1921 32.4 1922 48.4 1922 31.1 1928 64.6 1923 38.2 1929 58.4 1924 39.5 1980 38.6 1925 42.9 1981 51.4 1926 42.6 1982 84.4 12. Determine the period of the moving average for the following data and calculate moving averages for that period. Years 1 2 3 4 5 5 2 8 9 1C] 11 12 13 14 15 Value 130 12? 124 135 140 132 129 122'r 145 158 153 146 145 164 170 18. Flt a linear trend to the following data bv least squares method. Years 1994119921994199 1998 Production 18 21 23 22 16 {'000 unitsII Also estimate the production for the vear 1999. {Ans: Ye=21+0.1x; 21.5 thousand units} 19. The weights of the ca 1' taken at weekly intervals are given below. Fit a straight line using the method of least squares and calculate the average rate of growth per week. Years 1 2 3 4 5 6 2 8 9 10 11 12 13 14 15 Value 130 122 124 135 140 132 129 122 145 158 153 146 145 164 120 Also estimate the weight of the calf when age is I: 12 ii} 15 weeks. {Ans:6.16 units it 119.66 ll} 138.14}