Question
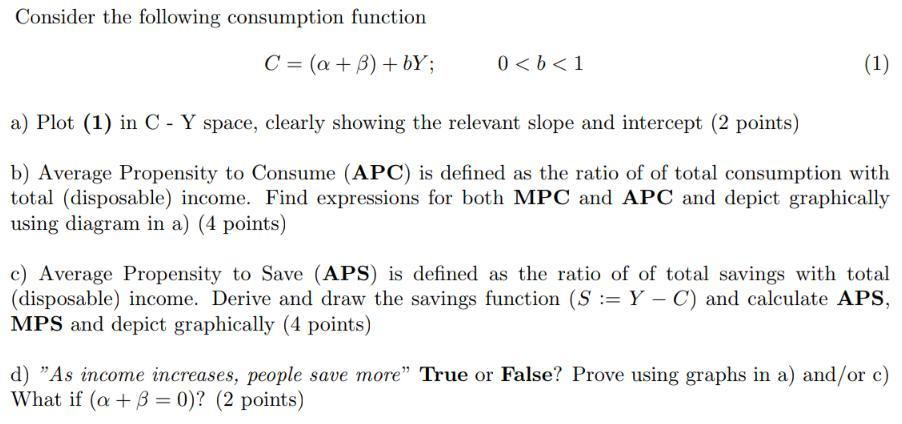
Consider the following consumption function C = (a + 3) +by; 0 < b < 1 (1) a) Plot (1) in C - Y

Consider the following consumption function C = (a + 3) +by; 0 < b < 1 (1) a) Plot (1) in C - Y space, clearly showing the relevant slope and intercept (2 points) b) Average Propensity to Consume (APC) is defined as the ratio of of total consumption with total (disposable) income. Find expressions for both MPC and APC and depict graphically using diagram in a) (4 points) c) Average Propensity to Save (APS) is defined as the ratio of of total savings with total (disposable) income. Derive and draw the savings function (S = Y C) and calculate APS, MPS and depict graphically (4 points) d) "As income increases, people save more" True or False? Prove using graphs in a) and/or c) What if (a + 3 = 0)? (2 points)
Step by Step Solution
3.46 Rating (159 Votes )
There are 3 Steps involved in it
Step: 1

Get Instant Access to Expert-Tailored Solutions
See step-by-step solutions with expert insights and AI powered tools for academic success
Step: 2

Step: 3

Ace Your Homework with AI
Get the answers you need in no time with our AI-driven, step-by-step assistance
Get StartedRecommended Textbook for
Systems Analysis and Design in a Changing World
Authors: John W. Satzinger, Robert B. Jackson, Stephen D. Burd
7th edition
1305117204, 176902031, 9780176902032, 9781305465268 , 978-1305117204
Students also viewed these Accounting questions
Question
Answered: 1 week ago
Question
Answered: 1 week ago
Question
Answered: 1 week ago
Question
Answered: 1 week ago
Question
Answered: 1 week ago
Question
Answered: 1 week ago
Question
Answered: 1 week ago
Question
Answered: 1 week ago
Question
Answered: 1 week ago
Question
Answered: 1 week ago
Question
Answered: 1 week ago
Question
Answered: 1 week ago
Question
Answered: 1 week ago
Question
Answered: 1 week ago
Question
Answered: 1 week ago
Question
Answered: 1 week ago
Question
Answered: 1 week ago
Question
Answered: 1 week ago
Question
Answered: 1 week ago
View Answer in SolutionInn App


