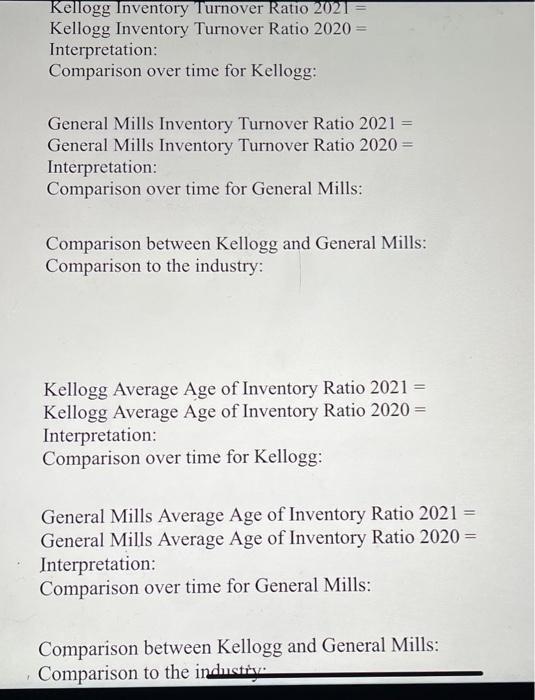
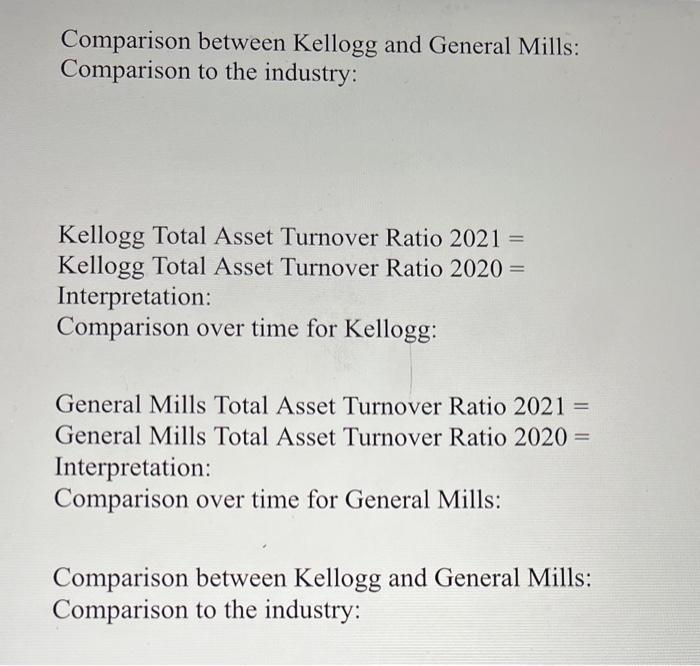
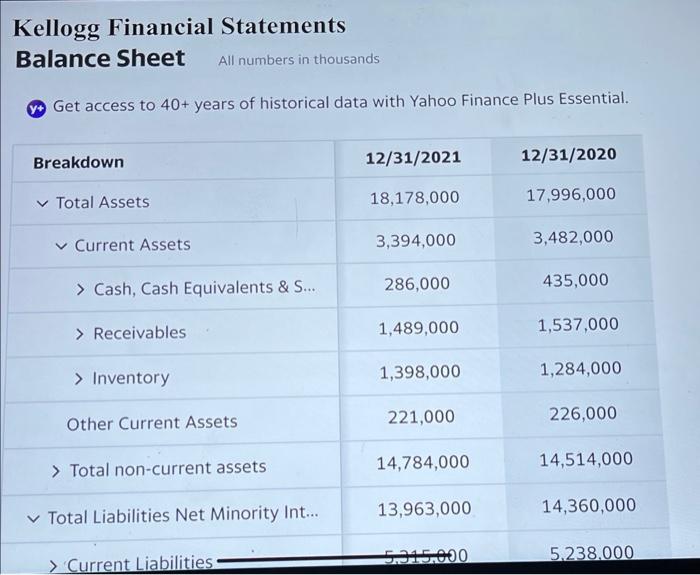
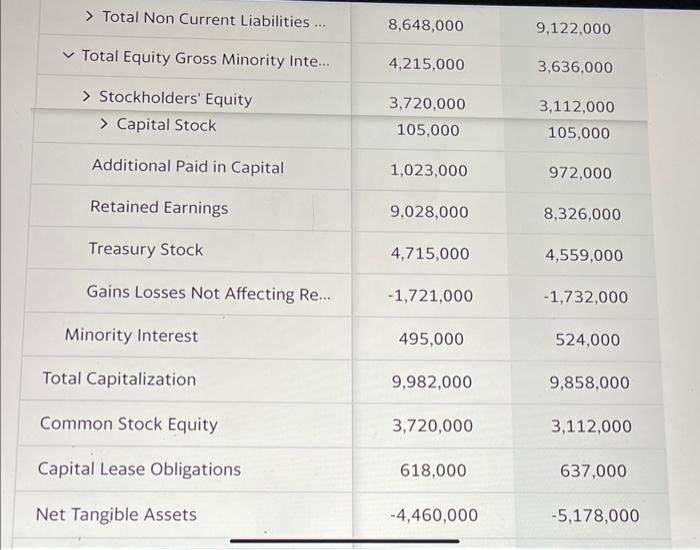
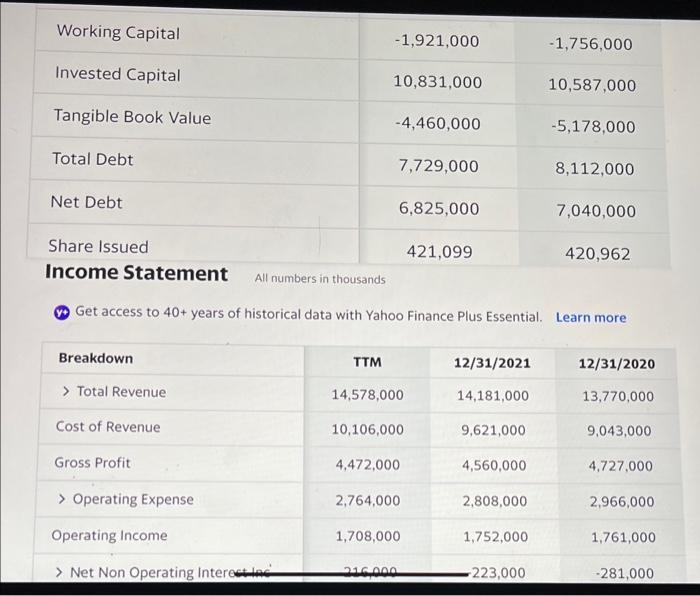
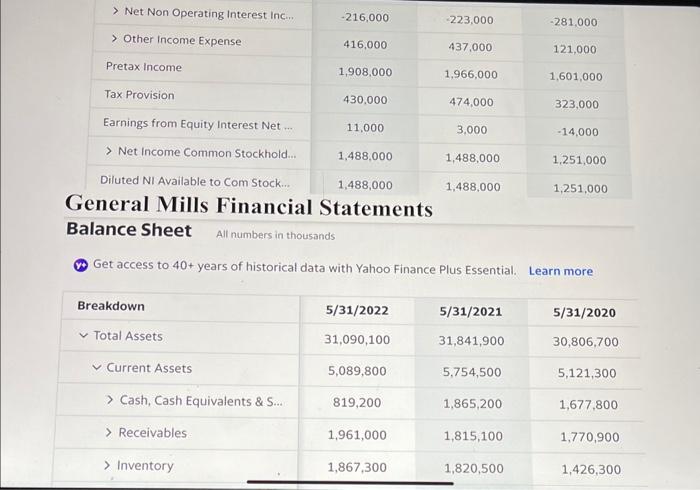
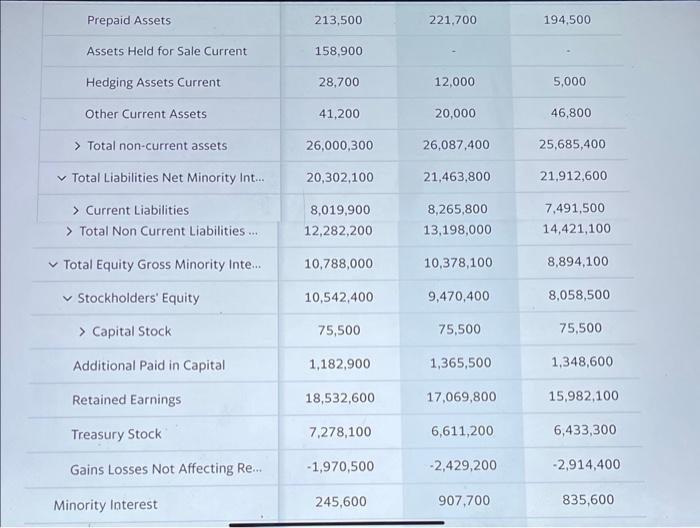
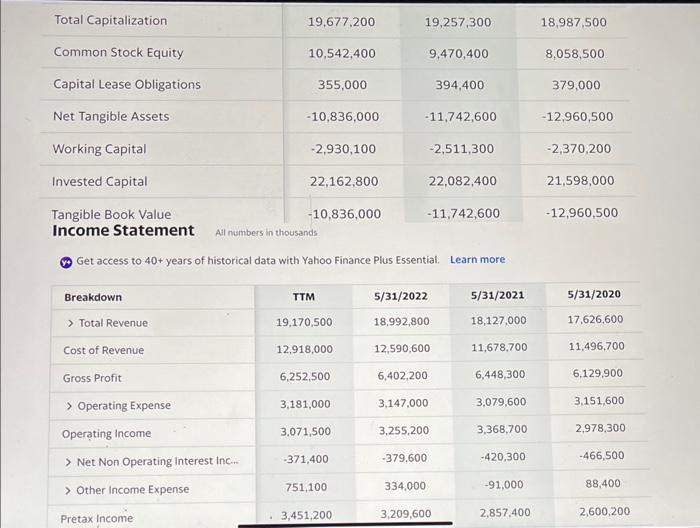
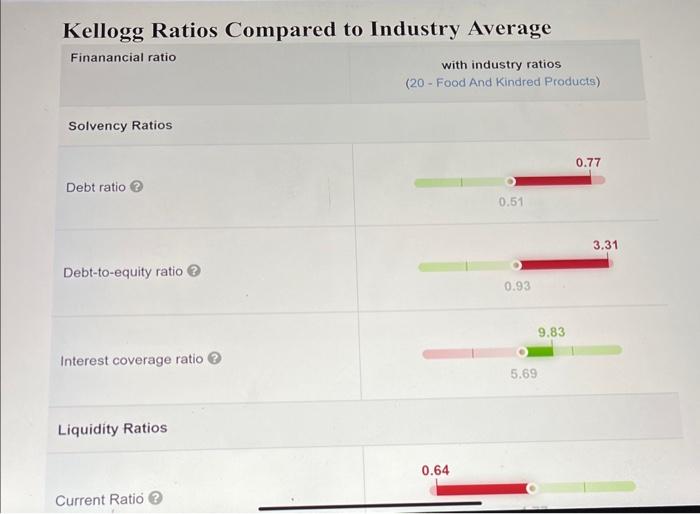
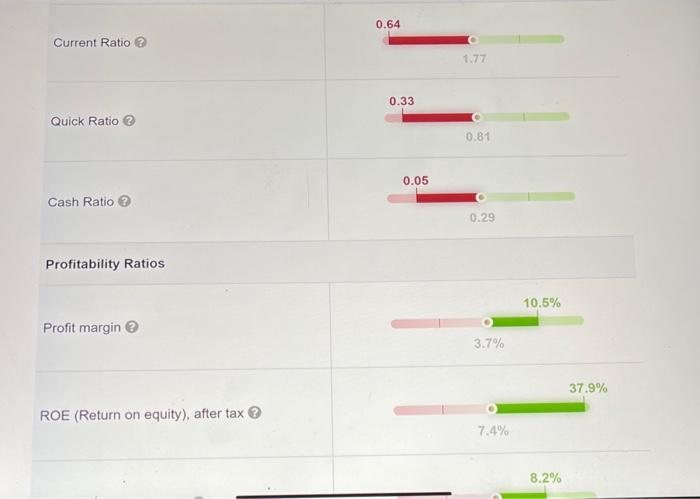
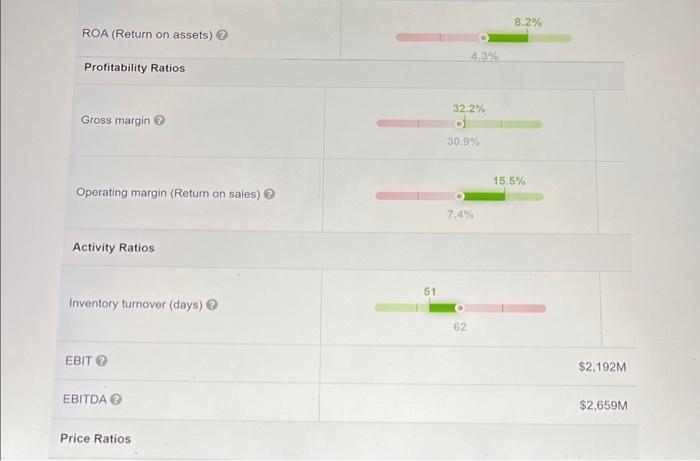
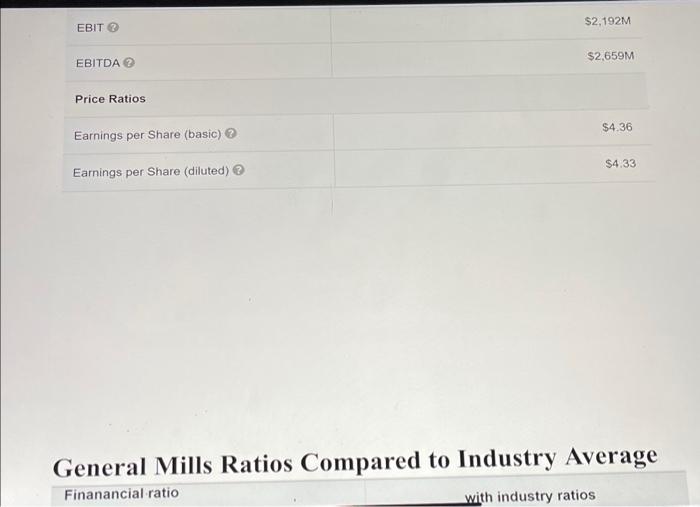
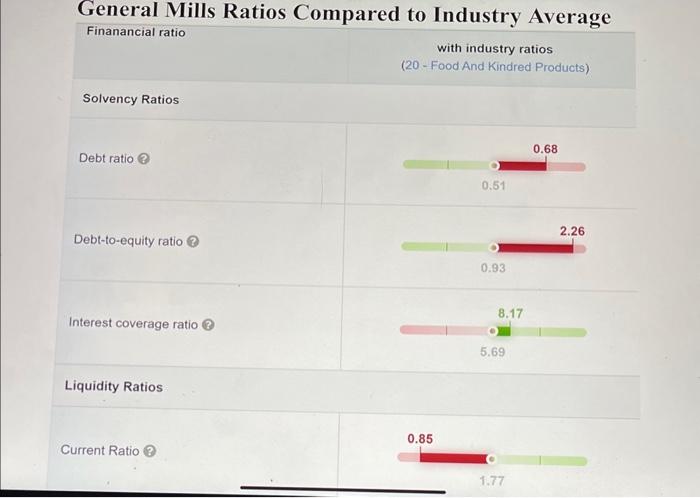
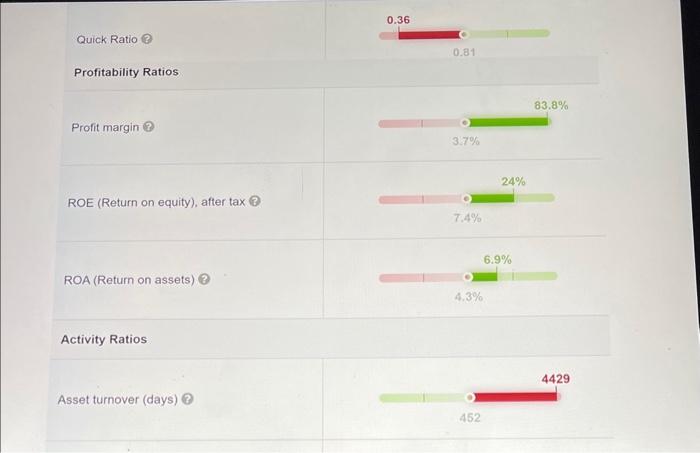
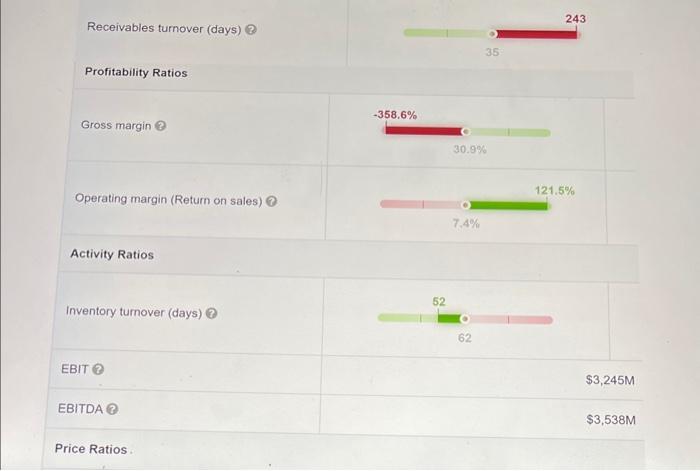
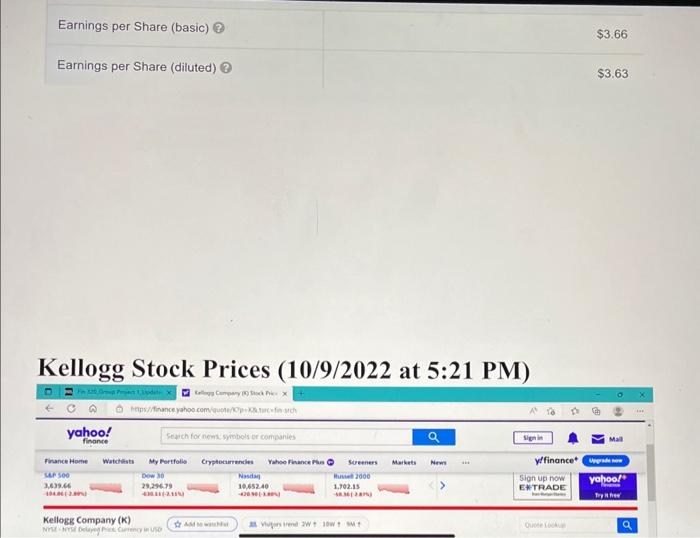
Kellogg Inventory Turnover Ratio 2021 = Kellogg Inventory Turnover Ratio 2020= Interpretation: Comparison over time for Kellogg: General Mills Inventory Turnover Ratio 2021= General Mills Inventory Turnover Ratio 2020= Interpretation: Comparison over time for General Mills: Comparison between Kellogg and General Mills: Comparison to the industry: Kellogg Average Age of Inventory Ratio 2021= Kellogg Average Age of Inventory Ratio 2020= Interpretation: Comparison over time for Kellogg: General Mills Average Age of Inventory Ratio 2021= General Mills Average Age of Inventory Ratio 2020= Interpretation: Comparison over time for General Mills: Comparison between Kellogg and General Mills: Comparison to the industriv. Comparison between Kellogg and General Mills: Comparison to the industry: Kellogg Total Asset Turnover Ratio 2021= Kellogg Total Asset Turnover Ratio 2020= Interpretation: Comparison over time for Kellogg: General Mills Total Asset Turnover Ratio 2021= General Mills Total Asset Turnover Ratio 2020= Interpretation: Comparison over time for General Mills: Comparison between Kellogg and General Mills: Comparison to the industry: Get access to 40+ years of historical data with Yahoo Finance Plus Essential. Get access to 40+ years of historical data with Yahoo Finance Plus Essential. Learn more Genera vills rinancial Statements Balance Sheet All numbers in thousands Get access to 40+ years of historical data with Yahoo Finance Plus Essential. Learn more Get access to 40+ years of historical data with Yahoo Finance Plus Essential \begin{tabular}{llcccc} \hline Tax Provision & 633,500 & 586,300 & 629,100 & 480,500 \\ \hline Earnings from Equity Interest Net ... & 102,400 & 111,700 & 117,700 & 91,100 \\ & > Net Income Common Stockhold & 2,900,300 & 2,707,300 & 2,339,800 & 2,181,200 \\ \hline \end{tabular} Kellogg Ratios Compared to Industry Average Finanancial ratio with industry ratios (20 - Food And Kindred Products) Solvency Ratios Debt ratio?? Liquidity Ratios Current Ratio (3) Current Ratio (3) Profitability Ratios Profit margin (3) ROE (Return on equity), after tax ? Activity Ratios Price Ratios General Mills Ratios Compared to Industry Average Finanancial ratio with industry ratios General Mills Ratios Compared to Industry Average Finanancial ratio Solvency Ratios Debt ratio ? Debt-to-equity ratio (2) Interest coverage ratio (3) (20 - Food And Kindred Products) Quick Ratio (3) Profitability Ratios Profit margin (2) ROE (Return on equity), after tax (3) ROA (Return on assets) (2) \begin{tabular}{rcr} 83.8% \\ \hline 1+1% \end{tabular} 24% 1.4% 6.9% 4.3% Activity Ratios Asset turnover (days) (3) Receivables turnover (days) (2) Profitability Ratios Gross margin (3) Activity Ratios Inventory turnover (days) 2 EBIT (2) EBITDA (2) Price Ratios. Kellogg Stock Prices (10/9/2022 at 5:21 PM)
