

Answered step by step
Verified Expert Solution
Question
1 Approved Answer
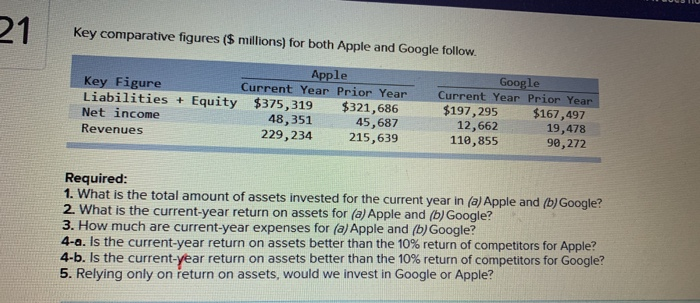
Key comparative figures ($ millions) for both Apple and Google follow. Apple Key Figure Current Year Prior Year Liabilities + Equity $375,319 $321,686 Net income
Step by Step Solution
There are 3 Steps involved in it
Step: 1

Get Instant Access to Expert-Tailored Solutions
See step-by-step solutions with expert insights and AI powered tools for academic success
Step: 2

Step: 3
Ace Your Homework with AI
Get the answers you need in no time with our AI-driven, step-by-step assistance
Get Started
The Politics Of Public Management The HRDC Audit Of Grants And Contributions
Authors: David A. Good
2nd Edition
0802085873, 978-0802085870