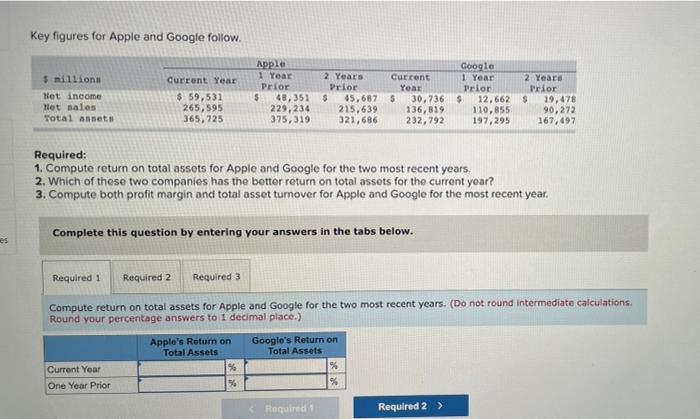
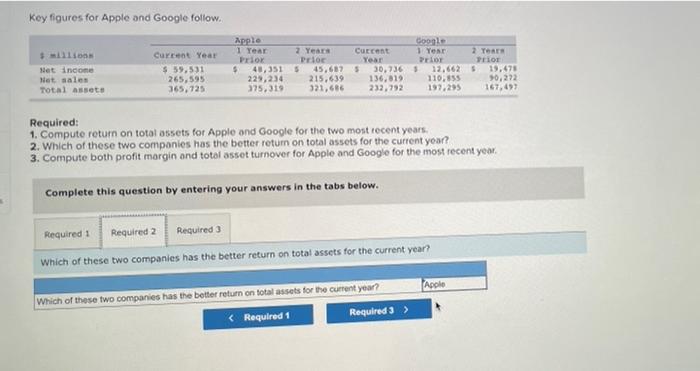
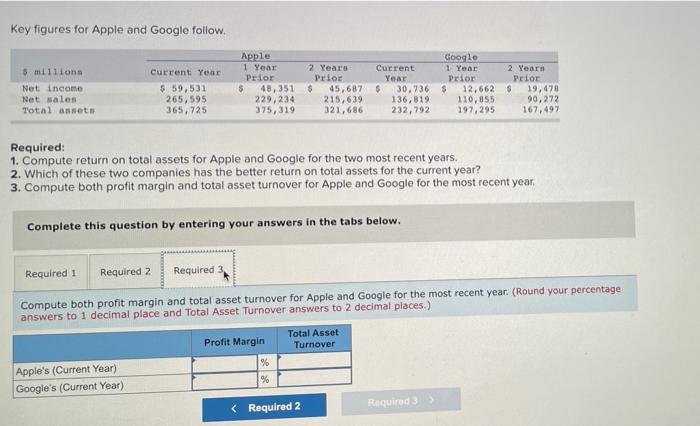
Key figures for Apple and Google follow. 3 million Net income Net sales Total anset Current Year $ 59,531 265,595 365,725 Apple 1 Year Prior $ 48,351 229, 234 375,319 2 Years Prior $ 45,687 215.639 321, 686 Google Current 1 Year 2 Years Year Prior Prior 30.736 $ 12,662 19,478 136,819 110,855 90,272 232,792 197,295 167,497 Required: 1. Compute return on total assets for Apple and Google for the two most recent years. 2. Which of these two companies has the better return on total assets for the current year? 3. Compute both profit margin and total asset turnover for Apple and Google for the most recent year. Complete this question by entering your answers in the tabs below. es Required 1 Required 2 Required 3 Compute return on total assets for Apple and Google for the two most recent years. (Do not round intermediate calculations. Round your percentage answers to 1 decimal place.) Apple's Return on Total Assets % % Google's Return on Total Assets % % Current Year One Year Prior Required Required 2 > Key figures for Apple and Google follow. sos Net income Net sales Total assets Current Year $ 59.531 265,595 365,725 Apple 1 Year 2 Year Prix Pro $ 40,3515 45,687 22,234 215.639 375,319 321,66 Google Current 1 Year Year Pro 5 30,736 12.662 136.619 110.855 232,792 197,295 2 Te PELOT $ 19,470 10,272 167,493 Required: 1. Compute return on total assets for Apple and Google for the two most recent years. 2. Which of these two companies has the better return on total assets for the current year? 3. Compute both profit margin and total asset turnover for Apple and Google for the most recent year. Complete this question by entering your answers in the tabs below. Required 1 Required 2 Required 3 Which of these two companies has the better return on total assets for the current year? Apple Which of these two companies has the better return on total assets for the current year? Key figures for Apple and Google follow. 5 million Net income Net sales Total assets Current Year $ 59,531 265,595 365,725 Apple Google 1 Year 2 Year Current 1 Year Prior Prior Year Prior $ 48,351 $ 45,687 $ 30,736 $ 12,662 229,234 215,639 136,819 110,055 375,319 321,686 232,792 197, 295 2 Year Prior $ 19,478 90,272 167,497 Required: 1. Compute return on total assets for Apple and Google for the two most recent years. 2. Which of these two companies has the better return on total assets for the current year? 3. Compute both profit margin and total asset turnover for Apple and Google for the most recent year, Complete this question by entering your answers in the tabs below. Required 1 Required 2 Required Compute both profit margin and total asset turnover for Apple and Google for the most recent year. (Round your percentage answers to 1 decimal place and Total Asset Turnover answers to 2 decimal places.) Profit Margin Total Asset Turnover % Apple's (Current Year) Google's (Current Year) % Required 3