

Answered step by step
Verified Expert Solution
Question
1 Approved Answer
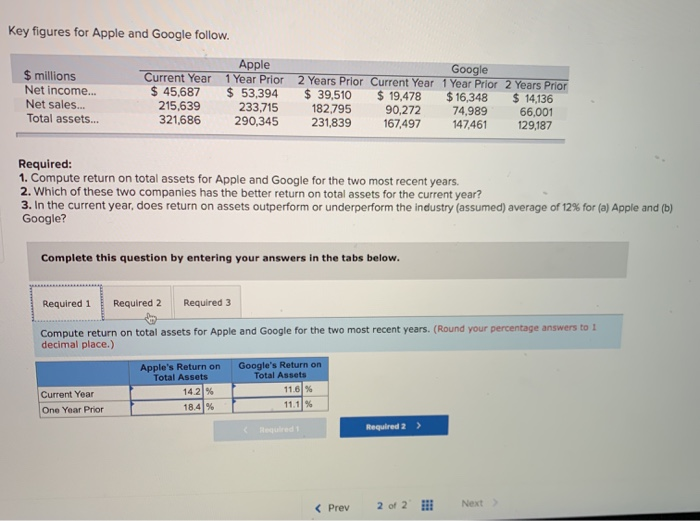
Key figures for Apple and Google follow. $ millions Net Income... Net sales... Total assets... Current Year $ 45,687 215,639 Apple 1 Year Prior $
Step by Step Solution
There are 3 Steps involved in it
Step: 1

Get Instant Access to Expert-Tailored Solutions
See step-by-step solutions with expert insights and AI powered tools for academic success
Step: 2

Step: 3
Ace Your Homework with AI
Get the answers you need in no time with our AI-driven, step-by-step assistance
Get Started
Forensic Accounting And Financial Statement Fraud Forensic Accounting Performance
Authors: Zabihollah Rezaee
1st Edition
1949991075, 978-1949991079