Answered step by step
Verified Expert Solution
Question
1 Approved Answer
QUESTION 2 A company reported the following information: Salaries payable, December 31, 2014 Salaries payable, December 31, 2013 Salaries expense for 2014 How much
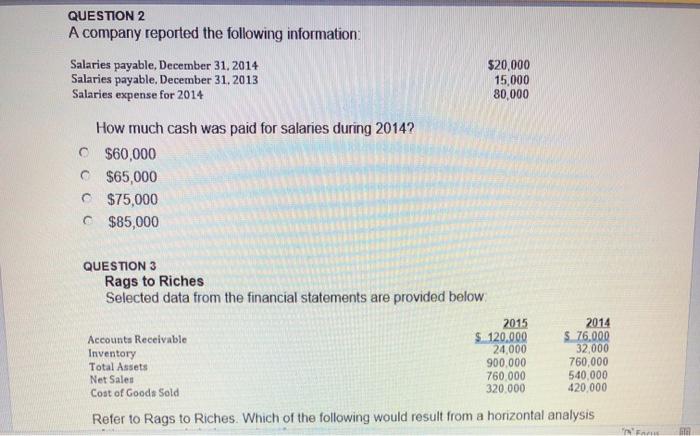
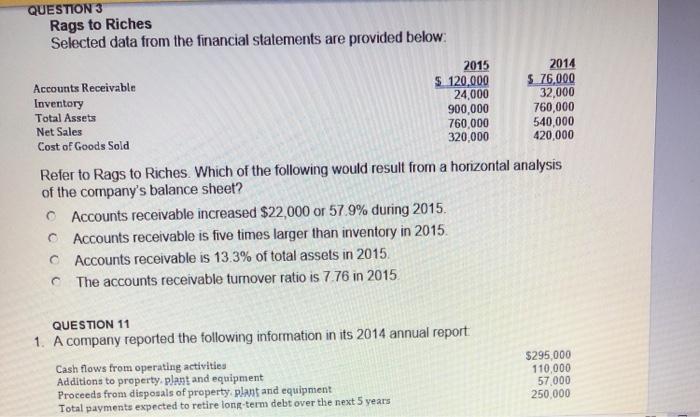
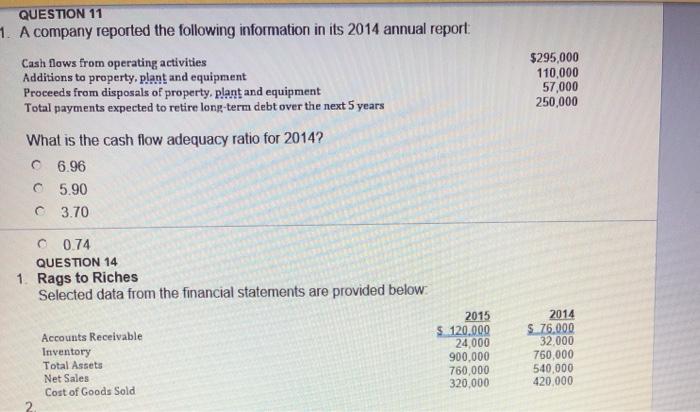
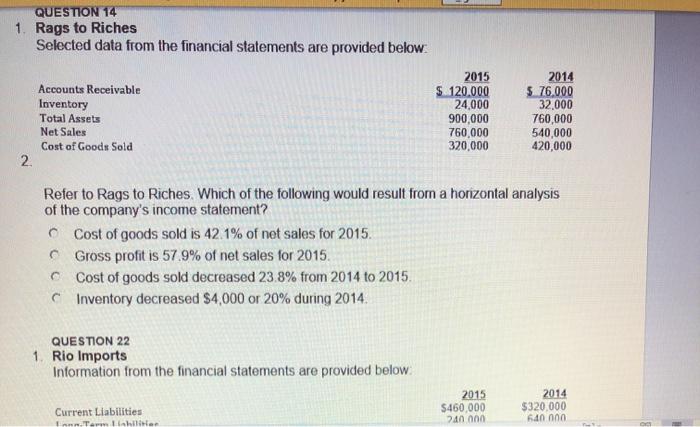
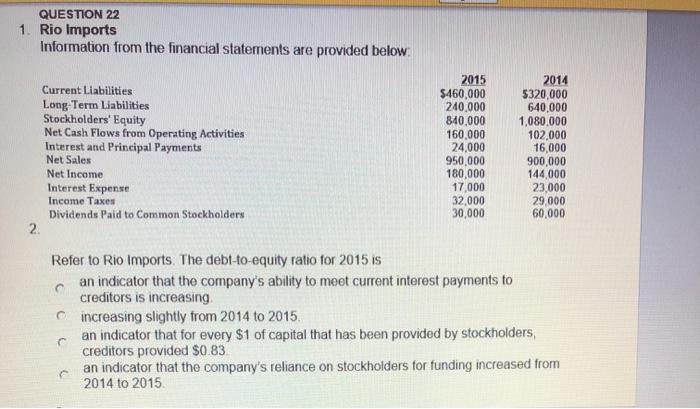
QUESTION 2 A company reported the following information: Salaries payable, December 31, 2014 Salaries payable, December 31, 2013 Salaries expense for 2014 How much cash was paid for salaries during 2014? $60,000 C$65,000 $75,000 C$85,000 QUESTION 3 Rags to Riches Selected data from the financial statements are provided below: Accounts Receivable Inventory $20,000 15,000 80,000 2015 $ 120.000 24,000 900,000 760,000 320,000 2014 $ 76.000 32,000 760,000 540,000 420,000 Total Assets Net Sales Cost of Goods Sold Refer to Rags to Riches. Which of the following would result from a horizontal analysis "O'Fars EST QUESTION 3 Rags to Riches Selected data from the financial statements are provided below: Accounts Receivable Inventory Total Assets Net Sales Cost of Goods Sold 2015 $ 120,000 24,000 900,000 760,000 320,000 Refer to Rags to Riches. Which of the following would result from a horizontal analysis of the company's balance sheet? Accounts receivable increased $22,000 or 57.9% during 2015. Accounts receivable is five times larger than inventory in 2015. CAccounts receivable is 13.3% of total assets in 2015. The accounts receivable turnover ratio is 7.76 in 2015 QUESTION 11 1. A company reported the following information in its 2014 annual report Cash flows from operating activities Additions to property, plant and equipment Proceeds from disposals of property, plant and equipment Total payments expected to retire long-term debt over the next 5 years 2014 $ 76,000 32,000 760,000 540,000 420,000 $295,000 110,000 57,000 250,000 QUESTION 11 1. A company reported the following information in its 2014 annual report: Cash flows from operating activities Additions to property, plant and equipment Proceeds from disposals of property, plant and equipment Total payments expected to retire long-term debt over the next 5 years What is the cash flow adequacy ratio for 2014? 6.96 5.90 C 3.70 C 0.74 QUESTION 14 1. Rags to Riches Selected data from the financial statements are provided below: 2. Accounts Receivable Inventory Total Assets Net Sales Cost of Goods Sold 2015 120.000 24,000 900,000 760,000 320,000 $295,000 110,000 57,000 250,000 2014 $ 76,000 32,000 760,000 540,000 420,000 QUESTION 14 1. Rags to Riches Selected data from the financial statements are provided below: 2. Accounts Receivable Inventory Total Assets Net Sales Cost of Goods Sold Cost of goods sold is 42.1% of net sales for 2015. Gross profit is 57.9% of net sales for 2015. Cost of goods sold decreased 23.8% from 2014 to 2015. Inventory decreased $4,000 or 20% during 2014. QUESTION 22 1. Rio Imports Information from the financial statements are provided below: 2015 $ 120.000 24,000 Current Liabilities Ennn-Term Lishilitien 900,000 760,000 320,000 Refer to Rags to Riches. Which of the following would result from a horizontal analysis of the company's income statement? 2014 $76,000 32,000 2015 $460,000 240.000 760,000 540,000 420,000 2014 $320,000 640.000 QUESTION 22 1. Rio Imports Information from the financial statements are provided below: 2. Current Liabilities - Long-Term Liabilities Stockholders' Equity Net Cash Flows from Operating Activities Interest and Principal Payments Net Sales Net Income Interest Expense Income Taxes Dividends Paid to Common Stockholders 2015 $460,000 240,000 840,000 160,000 24,000 950,000 180,000 17,000 32,000 30,000 Refer to Rio Imports. The debt-to-equity ratio for 2015 is C an indicator that the company's ability to meet current interest payments to creditors is increasing. 2014 $320,000 640,000 1,080,000 102,000 16,000 900,000 144,000 23,000 29,000 60,000 Cincreasing slightly from 2014 to 2015. C an indicator that for every $1 of capital that has been provided by stockholders, creditors provided $0.83. an indicator that the company's reliance on stockholders for funding increased from 2014 to 2015. QUESTION 2 A company reported the following information: Salaries payable, December 31, 2014 Salaries payable, December 31, 2013 Salaries expense for 2014 How much cash was paid for salaries during 2014? $60,000 C$65,000 $75,000 C$85,000 QUESTION 3 Rags to Riches Selected data from the financial statements are provided below: Accounts Receivable Inventory $20,000 15,000 80,000 2015 $ 120.000 24,000 900,000 760,000 320,000 2014 $ 76.000 32,000 760,000 540,000 420,000 Total Assets Net Sales Cost of Goods Sold Refer to Rags to Riches. Which of the following would result from a horizontal analysis "O'Fars EST QUESTION 3 Rags to Riches Selected data from the financial statements are provided below: Accounts Receivable Inventory Total Assets Net Sales Cost of Goods Sold 2015 $ 120,000 24,000 900,000 760,000 320,000 Refer to Rags to Riches. Which of the following would result from a horizontal analysis of the company's balance sheet? Accounts receivable increased $22,000 or 57.9% during 2015. Accounts receivable is five times larger than inventory in 2015. CAccounts receivable is 13.3% of total assets in 2015. The accounts receivable turnover ratio is 7.76 in 2015 QUESTION 11 1. A company reported the following information in its 2014 annual report Cash flows from operating activities Additions to property, plant and equipment Proceeds from disposals of property, plant and equipment Total payments expected to retire long-term debt over the next 5 years 2014 $ 76,000 32,000 760,000 540,000 420,000 $295,000 110,000 57,000 250,000 QUESTION 11 1. A company reported the following information in its 2014 annual report: Cash flows from operating activities Additions to property, plant and equipment Proceeds from disposals of property, plant and equipment Total payments expected to retire long-term debt over the next 5 years What is the cash flow adequacy ratio for 2014? 6.96 5.90 C 3.70 C 0.74 QUESTION 14 1. Rags to Riches Selected data from the financial statements are provided below: 2. Accounts Receivable Inventory Total Assets Net Sales Cost of Goods Sold 2015 120.000 24,000 900,000 760,000 320,000 $295,000 110,000 57,000 250,000 2014 $ 76,000 32,000 760,000 540,000 420,000 QUESTION 14 1. Rags to Riches Selected data from the financial statements are provided below: 2. Accounts Receivable Inventory Total Assets Net Sales Cost of Goods Sold Cost of goods sold is 42.1% of net sales for 2015. Gross profit is 57.9% of net sales for 2015. Cost of goods sold decreased 23.8% from 2014 to 2015. Inventory decreased $4,000 or 20% during 2014. QUESTION 22 1. Rio Imports Information from the financial statements are provided below: 2015 $ 120.000 24,000 Current Liabilities Ennn-Term Lishilitien 900,000 760,000 320,000 Refer to Rags to Riches. Which of the following would result from a horizontal analysis of the company's income statement? 2014 $76,000 32,000 2015 $460,000 240.000 760,000 540,000 420,000 2014 $320,000 640.000 QUESTION 22 1. Rio Imports Information from the financial statements are provided below: 2. Current Liabilities - Long-Term Liabilities Stockholders' Equity Net Cash Flows from Operating Activities Interest and Principal Payments Net Sales Net Income Interest Expense Income Taxes Dividends Paid to Common Stockholders 2015 $460,000 240,000 840,000 160,000 24,000 950,000 180,000 17,000 32,000 30,000 Refer to Rio Imports. The debt-to-equity ratio for 2015 is C an indicator that the company's ability to meet current interest payments to creditors is increasing. 2014 $320,000 640,000 1,080,000 102,000 16,000 900,000 144,000 23,000 29,000 60,000 Cincreasing slightly from 2014 to 2015. C an indicator that for every $1 of capital that has been provided by stockholders, creditors provided $0.83. an indicator that the company's reliance on stockholders for funding increased from 2014 to 2015.
Step by Step Solution
★★★★★
3.53 Rating (163 Votes )
There are 3 Steps involved in it
Step: 1
1 Answer75000 Explanations Salary Expense for 2014 80000 Add Salaries payable for 2013 15000 95000 L...
Get Instant Access to Expert-Tailored Solutions
See step-by-step solutions with expert insights and AI powered tools for academic success
Step: 2

Step: 3

Ace Your Homework with AI
Get the answers you need in no time with our AI-driven, step-by-step assistance
Get Started


