Answered step by step
Verified Expert Solution
Question
1 Approved Answer
kindly attach spreadsheet screenshots as the answers. kindly answer ASAP Stock Portfolio Challenge You have $100,000 to invest in the stock market. In this project


kindly attach spreadsheet screenshots as the answers. kindly answer ASAP
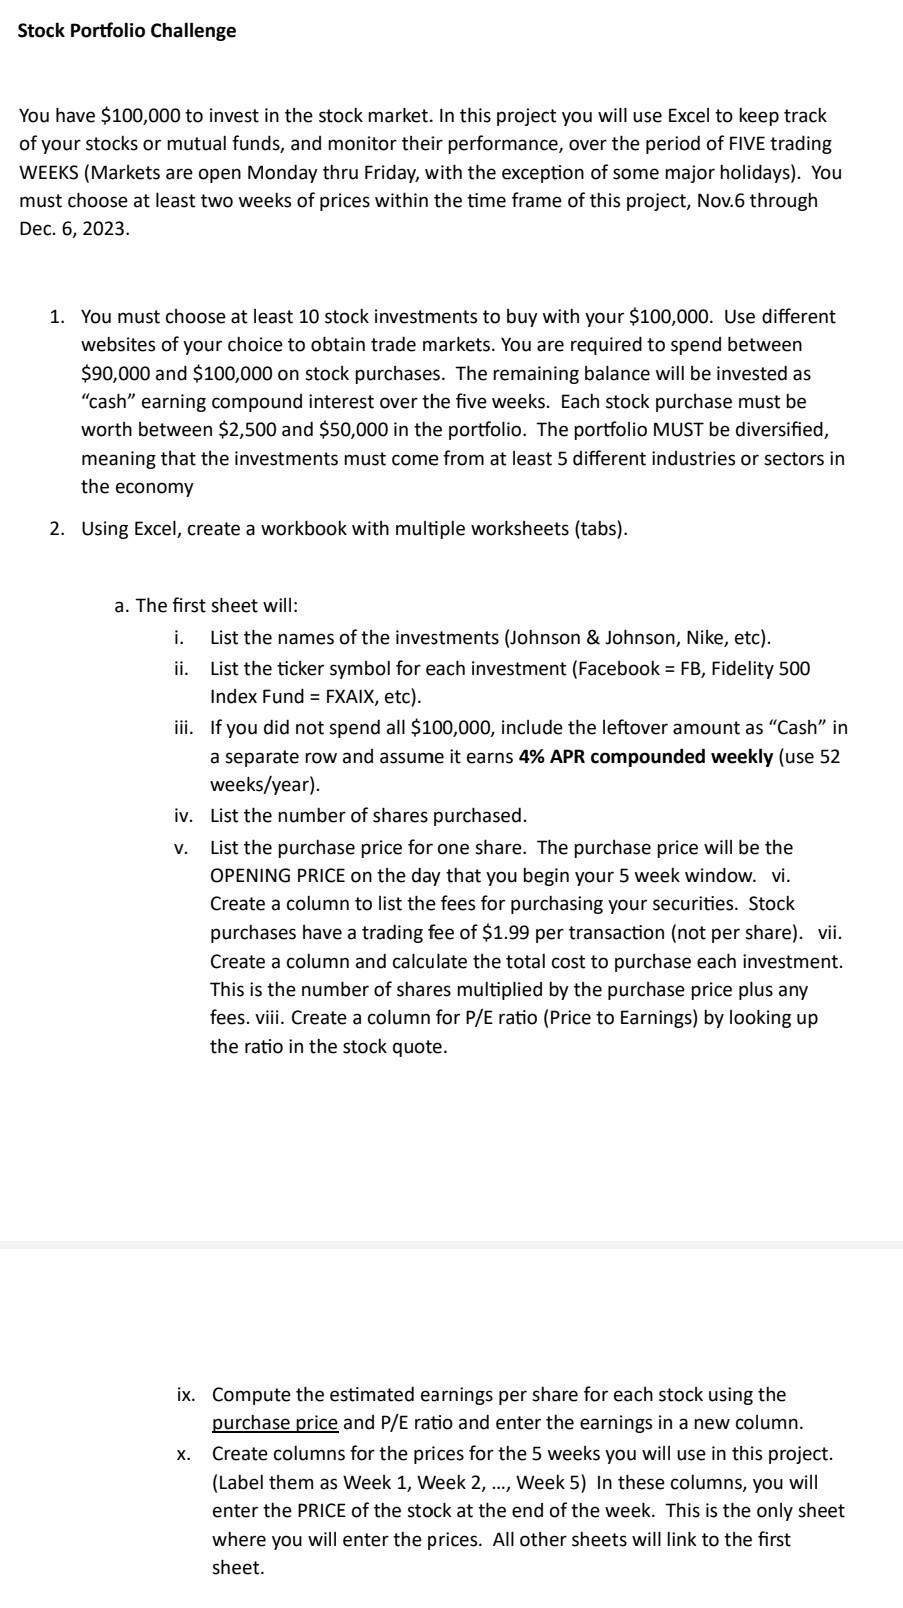
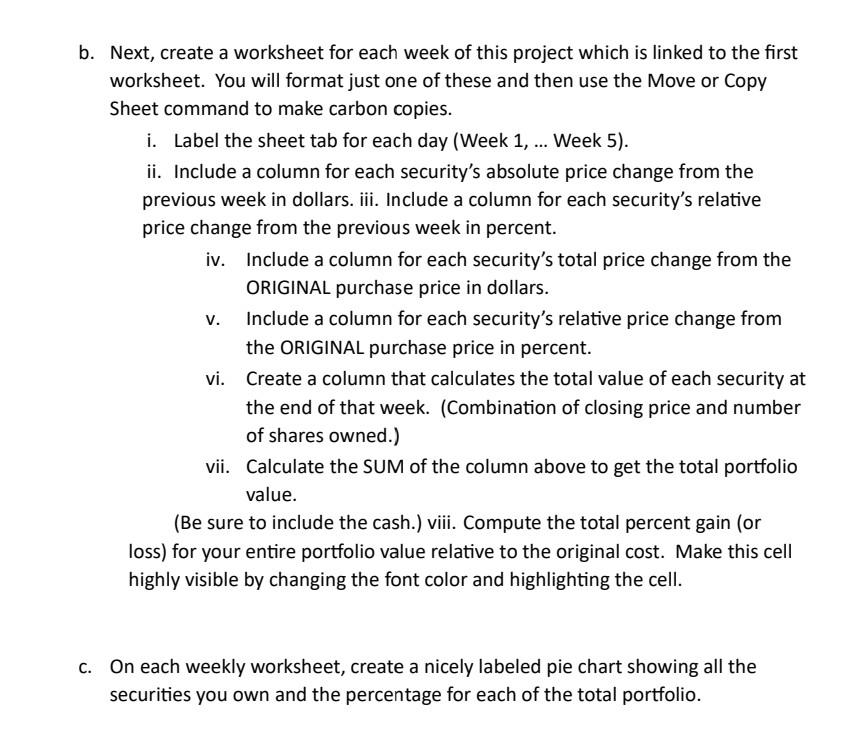
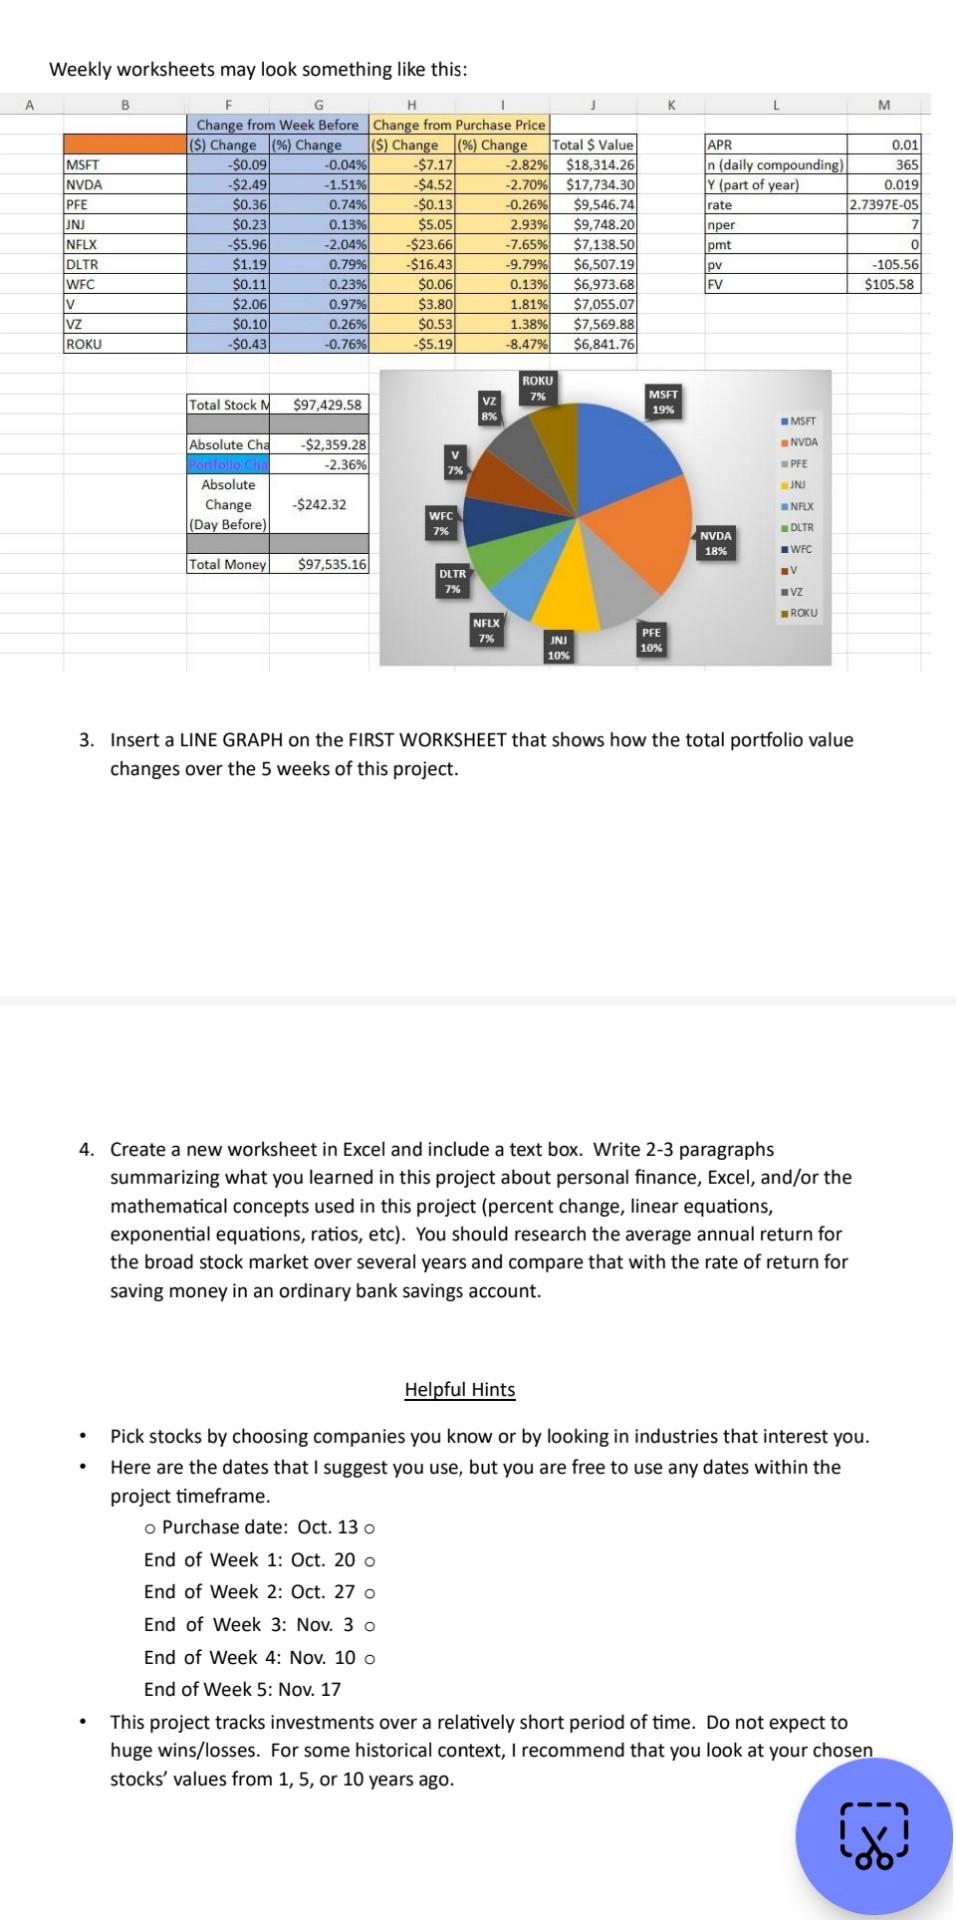
Stock Portfolio Challenge You have $100,000 to invest in the stock market. In this project you will use Excel to keep track of your stocks or mutual funds, and monitor their performance, over the period of FIVE trading WEEKS (Markets are open Monday thru Friday, with the exception of some major holidays). You must choose at least two weeks of prices within the time frame of this project, Nov.6 through Dec. 6, 2023. 1. You must choose at least 10 stock investments to buy with your $100,000. Use different websites of your choice to obtain trade markets. You are required to spend between $90,000 and $100,000 on stock purchases. The remaining balance will be invested as "cash" earning compound interest over the five weeks. Each stock purchase must be worth between $2,500 and $50,000 in the portfolio. The portfolio MUST be diversified, meaning that the investments must come from at least 5 different industries or sectors in the economy 2. Using Excel, create a workbook with multiple worksheets (tabs). a. The first sheet will: i. List the names of the investments (Johnson \& Johnson, Nike, etc). ii. List the ticker symbol for each investment (Facebook = FB, Fidelity 500 Index Fund = FXAIX, etc). iii. If you did not spend all $100,000, include the leftover amount as "Cash" in a separate row and assume it earns 4% APR compounded weekly (use 52 weeks/year). iv. List the number of shares purchased. v. List the purchase price for one share. The purchase price will be the OPENING PRICE on the day that you begin your 5 week window. vi. Create a column to list the fees for purchasing your securities. Stock purchases have a trading fee of $1.99 per transaction (not per share). vii. Create a column and calculate the total cost to purchase each investment. This is the number of shares multiplied by the purchase price plus any fees. viii. Create a column for P/E ratio (Price to Earnings) by looking up the ratio in the stock quote. ix. Compute the estimated earnings per share for each stock using the purchase price and P/E ratio and enter the earnings in a new column. x. Create columns for the prices for the 5 weeks you will use in this project. (Label them as Week 1, Week 2,..., Week 5) In these columns, you will enter the PRICE of the stock at the end of the week. This is the only sheet where you will enter the prices. All other sheets will link to the first sheet. b. Next, create a worksheet for each week of this project which is linked to the first worksheet. You will format just one of these and then use the Move or Copy Sheet command to make carbon copies. i. Label the sheet tab for each day (Week 1,... Week 5). ii. Include a column for each security's absolute price change from the previous week in dollars. iii. Include a column for each security's relative price change from the previous week in percent. iv. Include a column for each security's total price change from the ORIGINAL purchase price in dollars. v. Include a column for each security's relative price change from the ORIGINAL purchase price in percent. vi. Create a column that calculates the total value of each security at the end of that week. (Combination of closing price and number of shares owned.) vii. Calculate the SUM of the column above to get the total portfolio value. (Be sure to include the cash.) viii. Compute the total percent gain (or loss) for your entire portfolio value relative to the original cost. Make this cell highly visible by changing the font color and highlighting the cell. c. On each weekly worksheet, create a nicely labeled pie chart showing all the securities you own and the percentage for each of the total portfolio. Weekly worksheets may look something like this: 3. Insert a LINE GRAPH on the FIRST WORKSHEET that shows how the total portfolio value changes over the 5 weeks of this project. 4. Create a new worksheet in Excel and include a text box. Write 2-3 paragraphs summarizing what you learned in this project about personal finance, Excel, and/or the mathematical concepts used in this project (percent change, linear equations, exponential equations, ratios, etc). You should research the average annual return for the broad stock market over several years and compare that with the rate of return for saving money in an ordinary bank savings account. Helpful Hints - Pick stocks by choosing companies you know or by looking in industries that interest you. - Here are the dates that I suggest you use, but you are free to use any dates within the project timeframe. Purchase date: Oct. 13 End of Week 1: Oct. 20 End of Week 2: Oct. 27 End of Week 3: Nov. 3 End of Week 4: Nov. 10 End of Week 5: Nov. 17 - This project tracks investments over a relatively short period of time. Do not expect to huge wins/losses. For some historical context, I recommend that you look at your chosen stocks' values from 1,5 , or 10 years agoStep by Step Solution
There are 3 Steps involved in it
Step: 1

Get Instant Access to Expert-Tailored Solutions
See step-by-step solutions with expert insights and AI powered tools for academic success
Step: 2

Step: 3

Ace Your Homework with AI
Get the answers you need in no time with our AI-driven, step-by-step assistance
Get Started


