Kindly, i need it to be solved ASAP
Thanks in advance
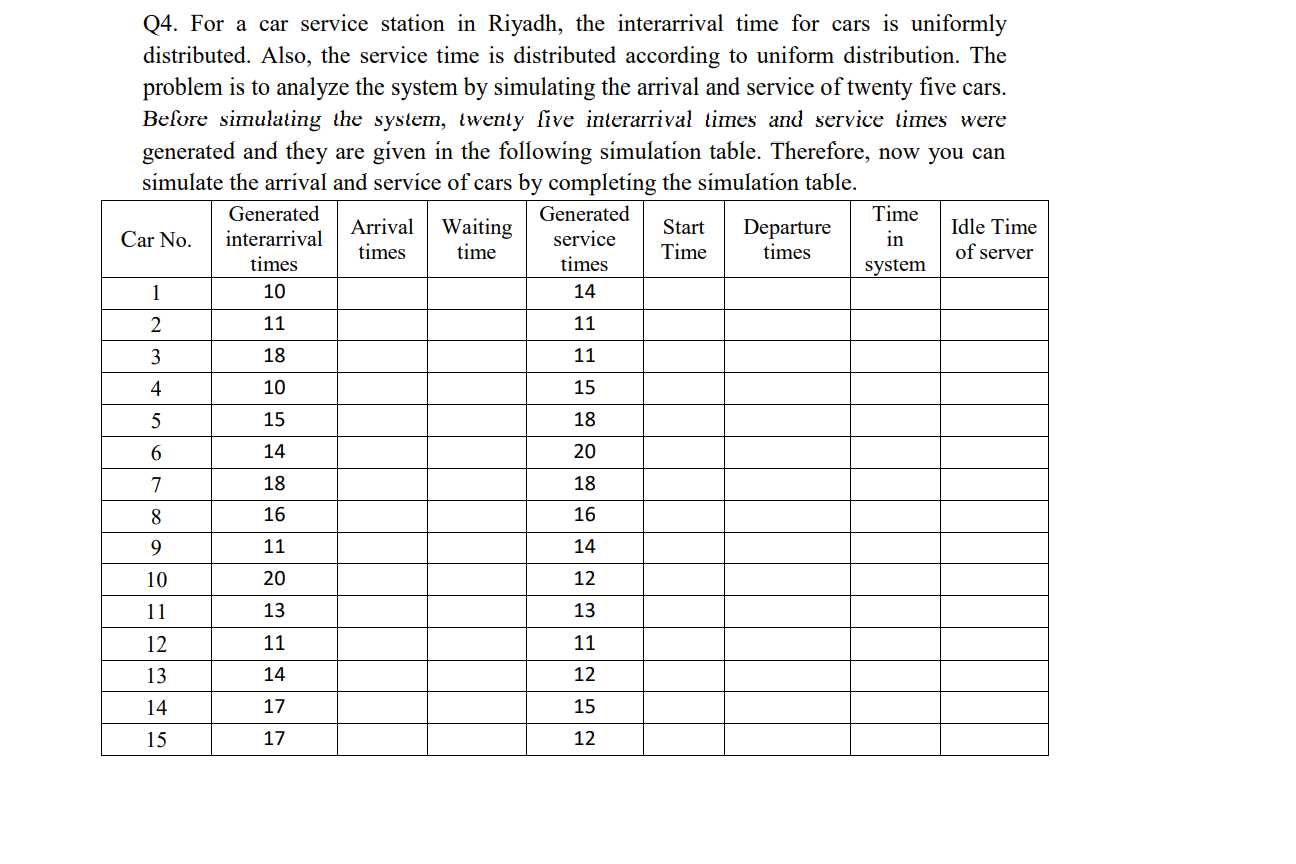
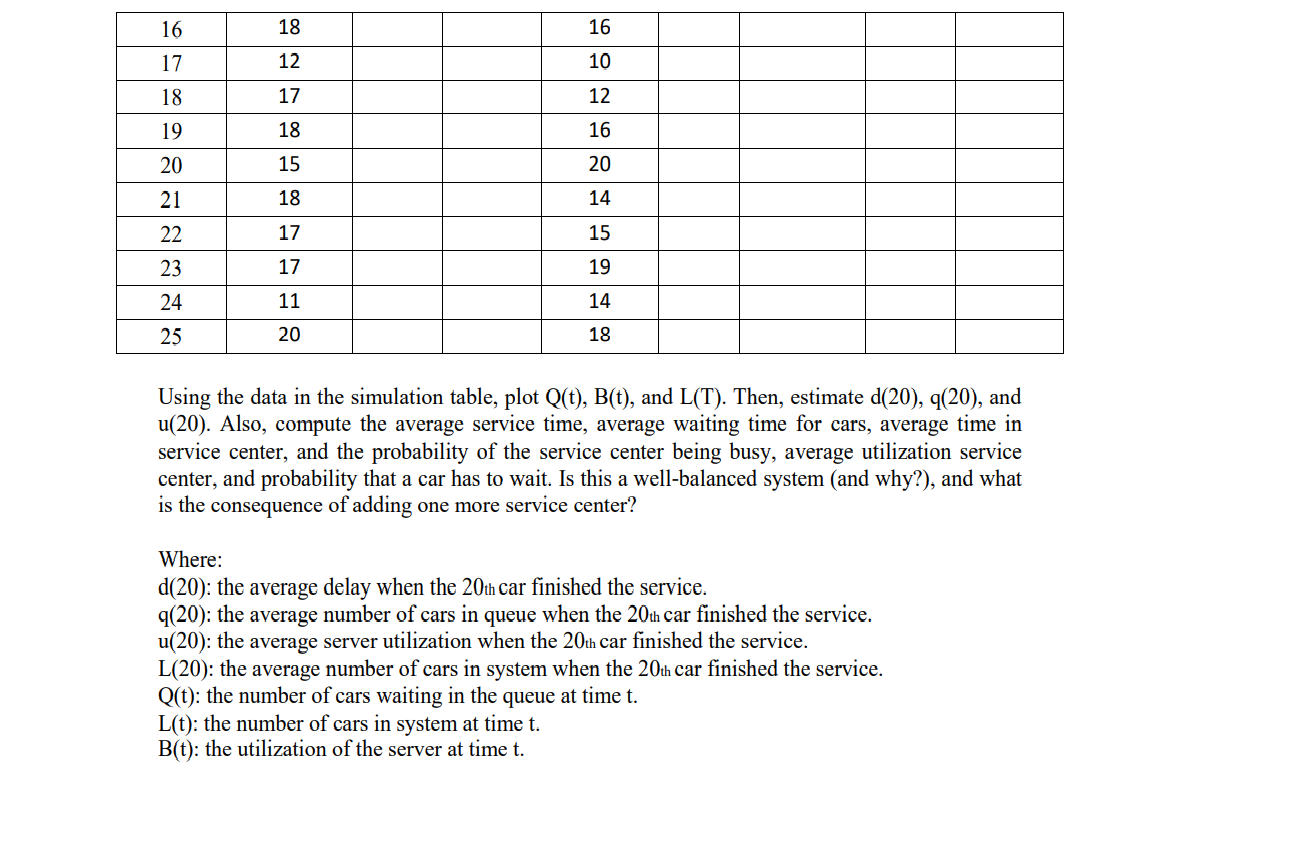
Q4. For a car service station in Riyadh, the interarrival time for cars is uniformly distributed. Also, the service time is distributed according to uniform distribution. The problem is to analyze the system by simulating the arrival and service of twenty five cars. Before simulating the system, twenty five interarrival times and service times were generated and they are given in the following simulation table. Therefore, now you can simulate the arrival and service of cars by completing the simulation table. Generated Generated Time Arrival Waiting Start Car No. Idle Time interarrival service Departure in times time Time times of server times times system 10 1 14 2 11 11 3 18 11 4 10 15 5 15 18 6 14 20 7 18 18 8 16 16 9 11 14 10 20 12 11 13 13 12 11 11 13 14 12 14 17 15 15 17 12 16 18 16 17 12 10 18 17 12 19 18 16 20 15 20 21 18 14 22 17 15 17 19 23 24 11 14 25 20 18 Using the data in the simulation table, plot Q(t), B(t), and L(T). Then, estimate d(20), q(20), and u(20). Also, compute the average service time, average waiting time for cars, average time in service center, and the probability of the service center being busy, average utilization service center, and probability that a car has to wait. Is this a well-balanced system (and why?), and what is the consequence of adding one more service center? Where: d(20): the average delay when the 20th car finished the service. 9(20): the average number of cars in queue when the 20th car finished the service. u(20): the average server utilization when the 20th car finished the service. L(20): the average number of cars in system when the 20th car finished the service. Q(t): the number of cars waiting in the queue at time t. L(t): the number of cars in system at time t. B(t): the utilization of the server at time t. Q4. For a car service station in Riyadh, the interarrival time for cars is uniformly distributed. Also, the service time is distributed according to uniform distribution. The problem is to analyze the system by simulating the arrival and service of twenty five cars. Before simulating the system, twenty five interarrival times and service times were generated and they are given in the following simulation table. Therefore, now you can simulate the arrival and service of cars by completing the simulation table. Generated Generated Time Arrival Waiting Start Car No. Idle Time interarrival service Departure in times time Time times of server times times system 10 1 14 2 11 11 3 18 11 4 10 15 5 15 18 6 14 20 7 18 18 8 16 16 9 11 14 10 20 12 11 13 13 12 11 11 13 14 12 14 17 15 15 17 12 16 18 16 17 12 10 18 17 12 19 18 16 20 15 20 21 18 14 22 17 15 17 19 23 24 11 14 25 20 18 Using the data in the simulation table, plot Q(t), B(t), and L(T). Then, estimate d(20), q(20), and u(20). Also, compute the average service time, average waiting time for cars, average time in service center, and the probability of the service center being busy, average utilization service center, and probability that a car has to wait. Is this a well-balanced system (and why?), and what is the consequence of adding one more service center? Where: d(20): the average delay when the 20th car finished the service. 9(20): the average number of cars in queue when the 20th car finished the service. u(20): the average server utilization when the 20th car finished the service. L(20): the average number of cars in system when the 20th car finished the service. Q(t): the number of cars waiting in the queue at time t. L(t): the number of cars in system at time t. B(t): the utilization of the server at time t