Kindly please digitalized the answer Patterns of Data in Scatter Diagram Linearity refers to whether a data pattern is linear (straight) or nonlinear (curved) 25
Kindly please digitalized the answer
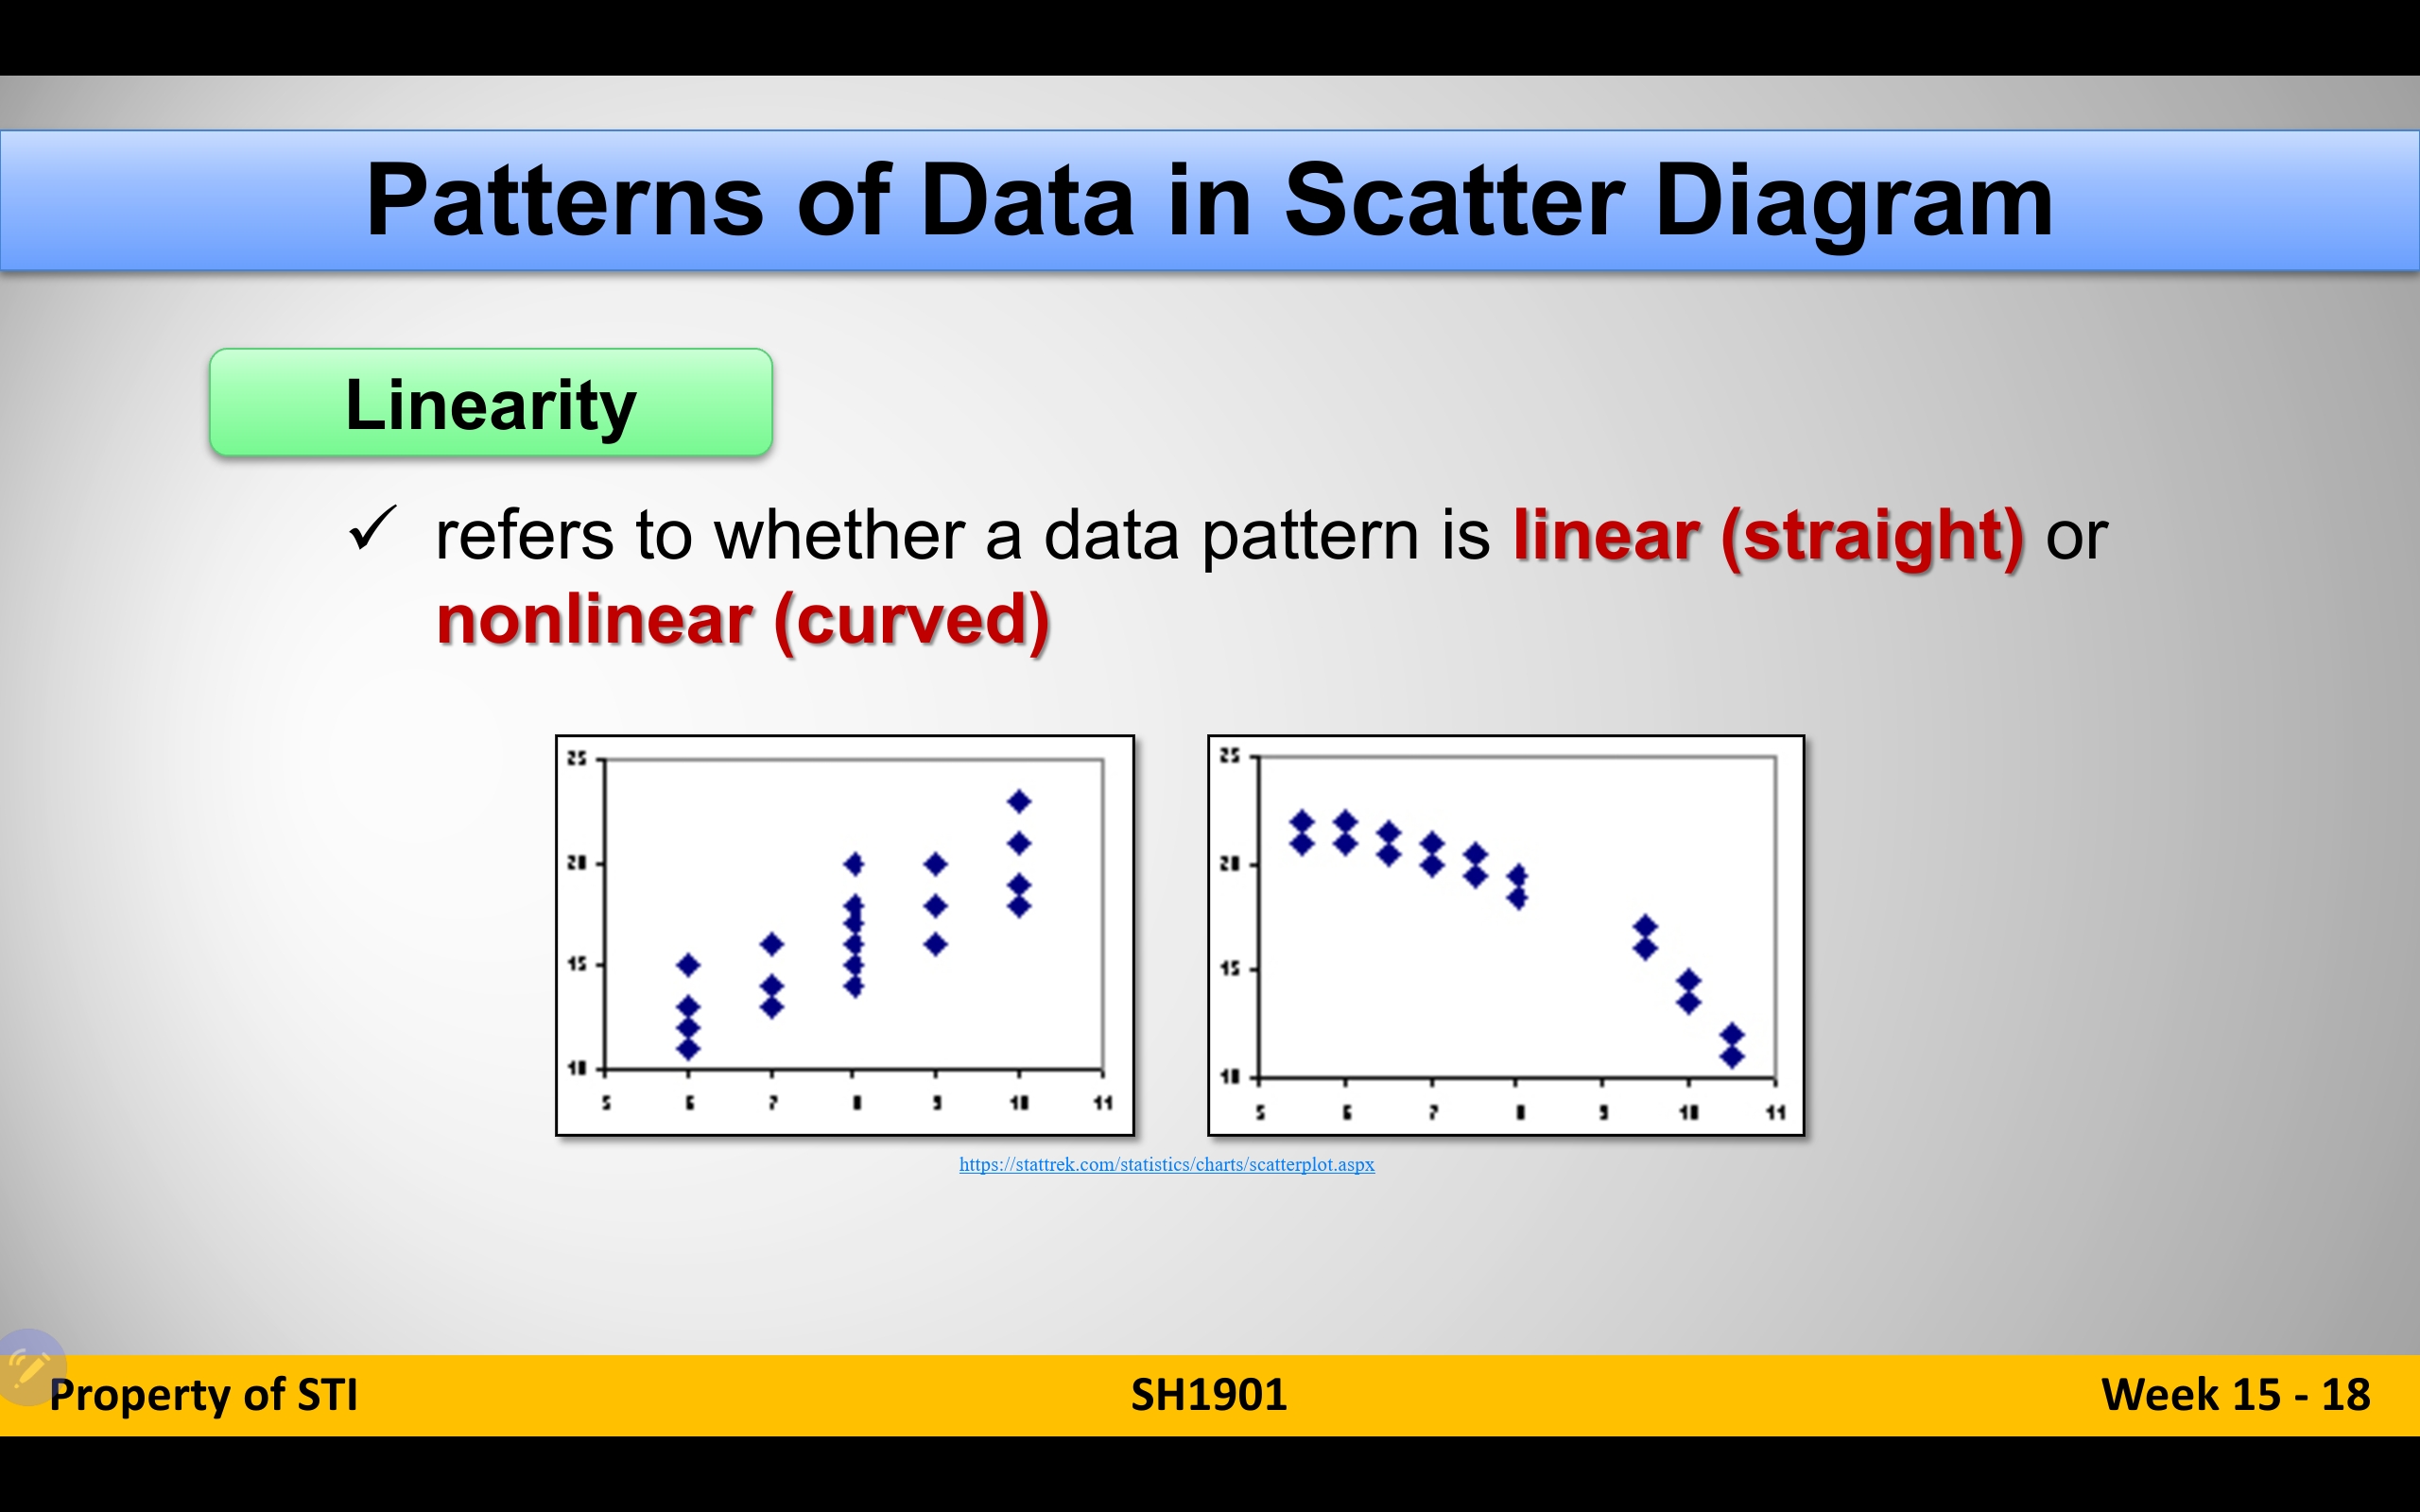
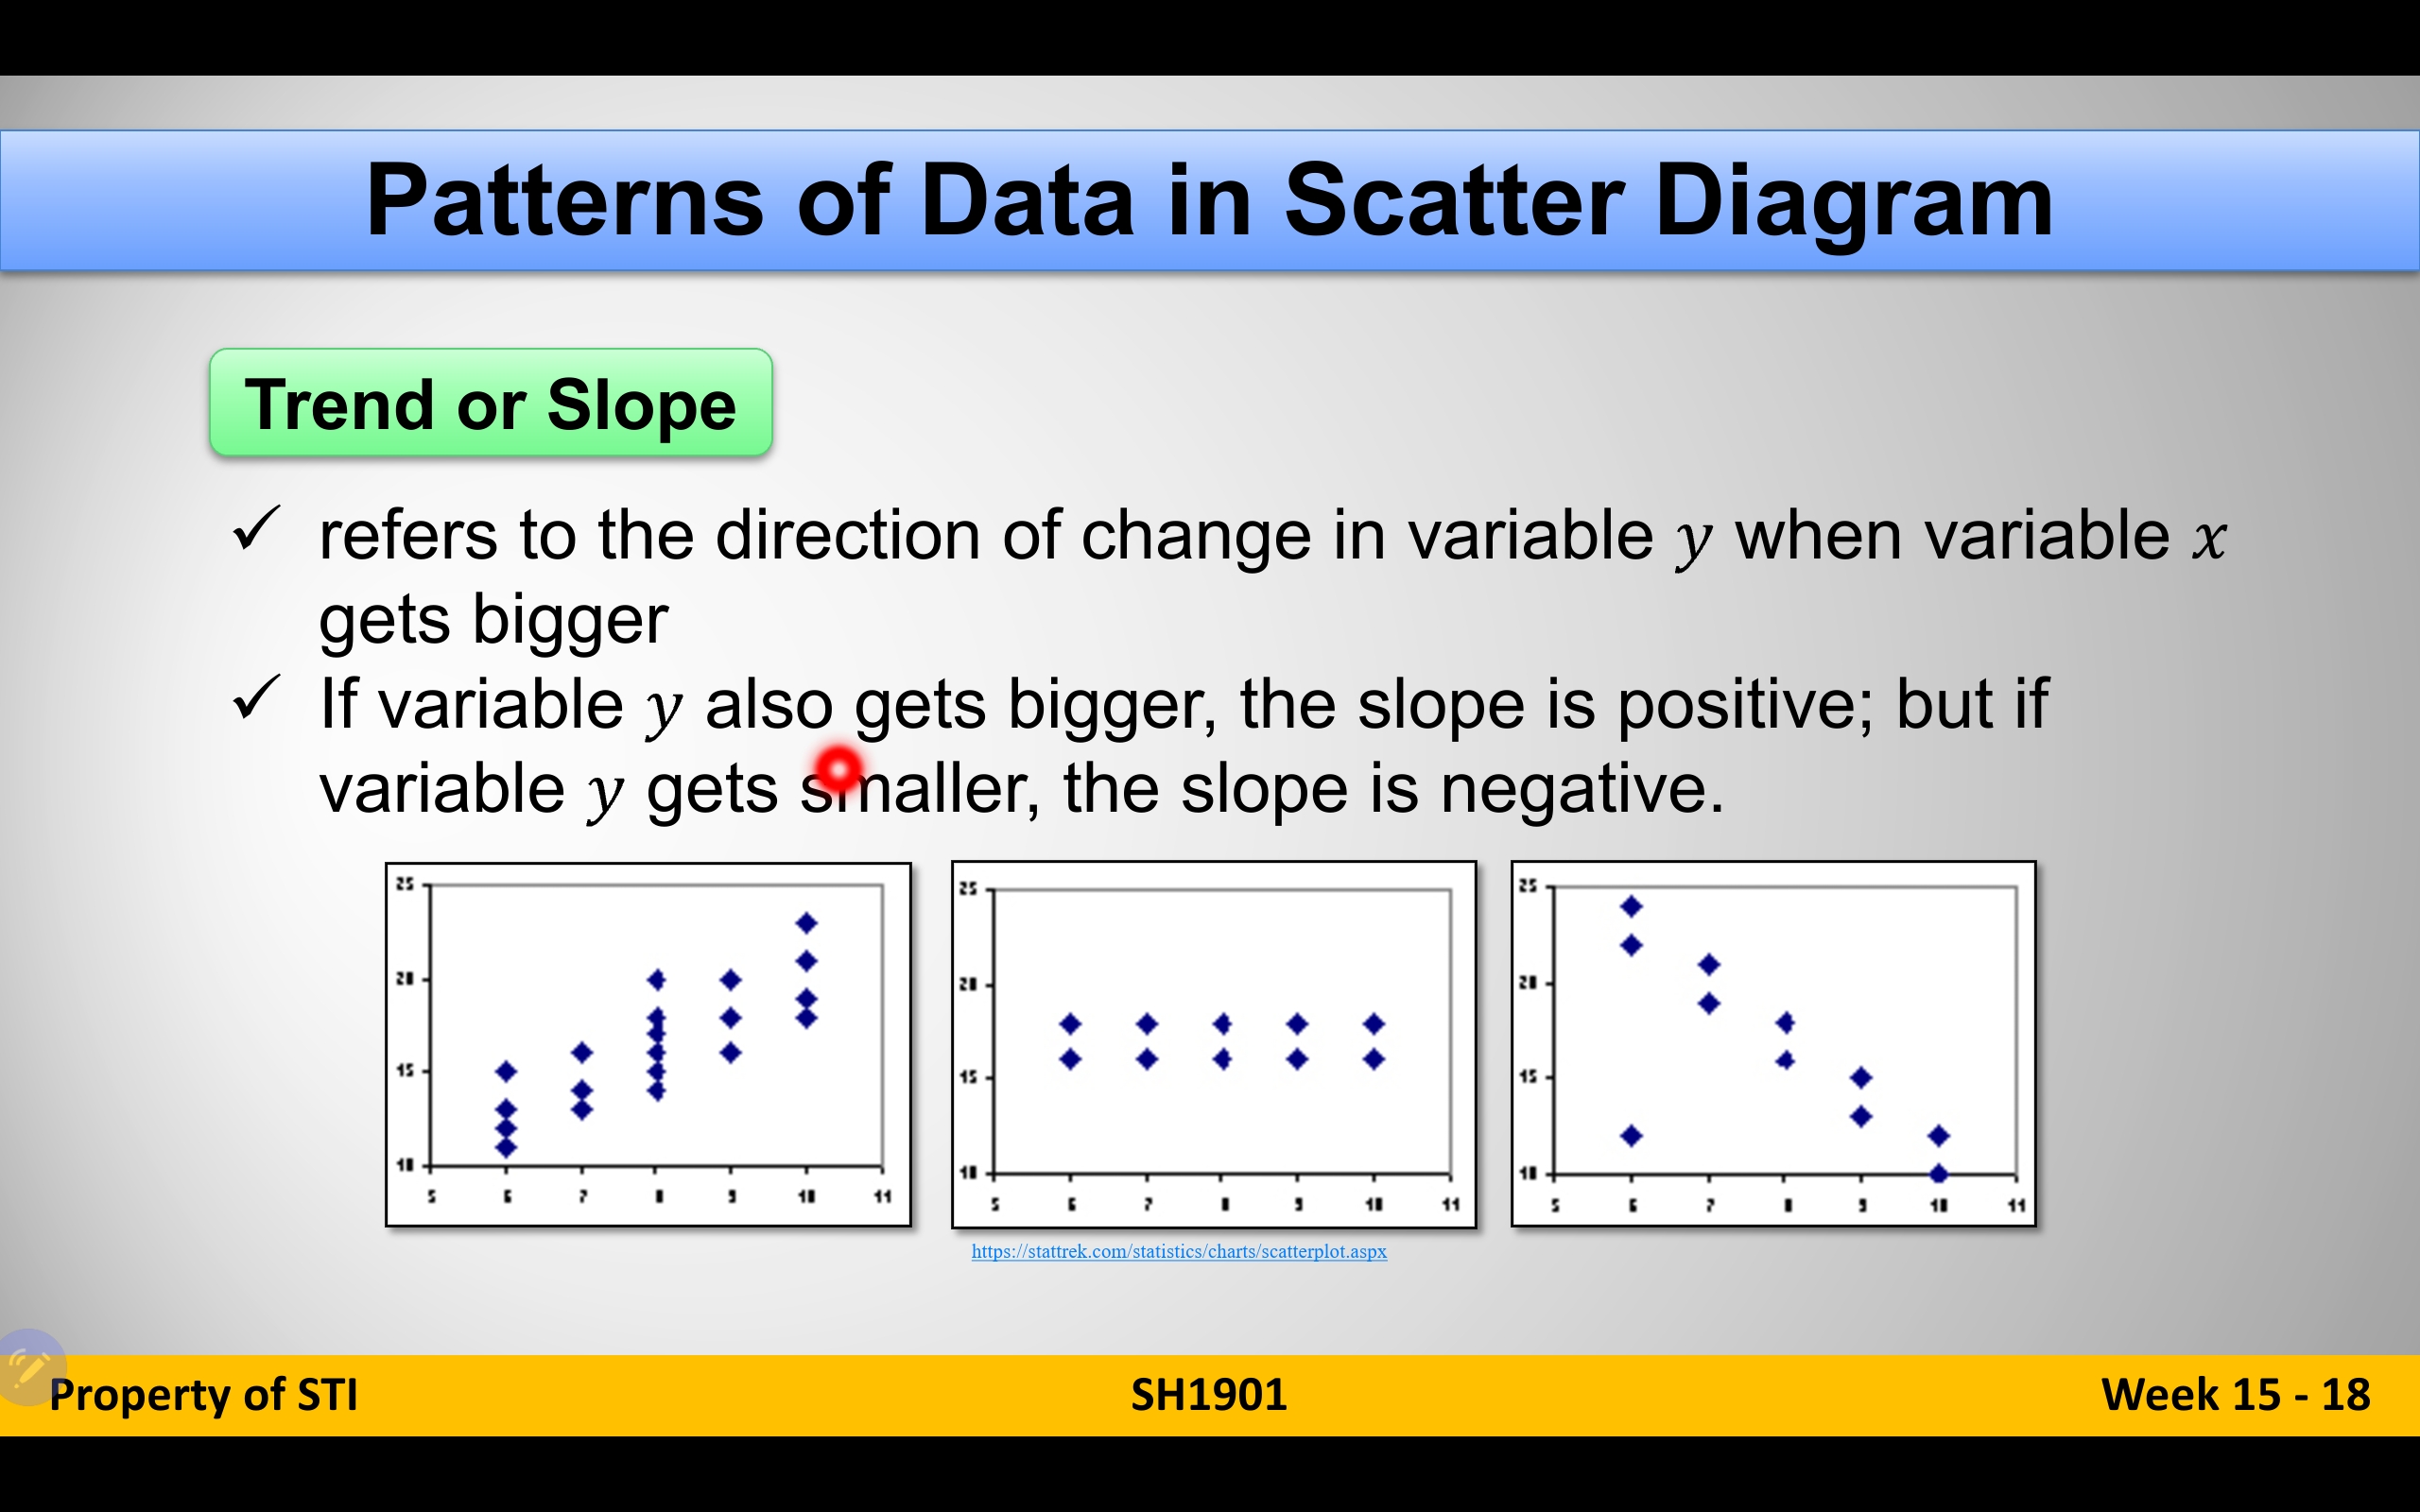
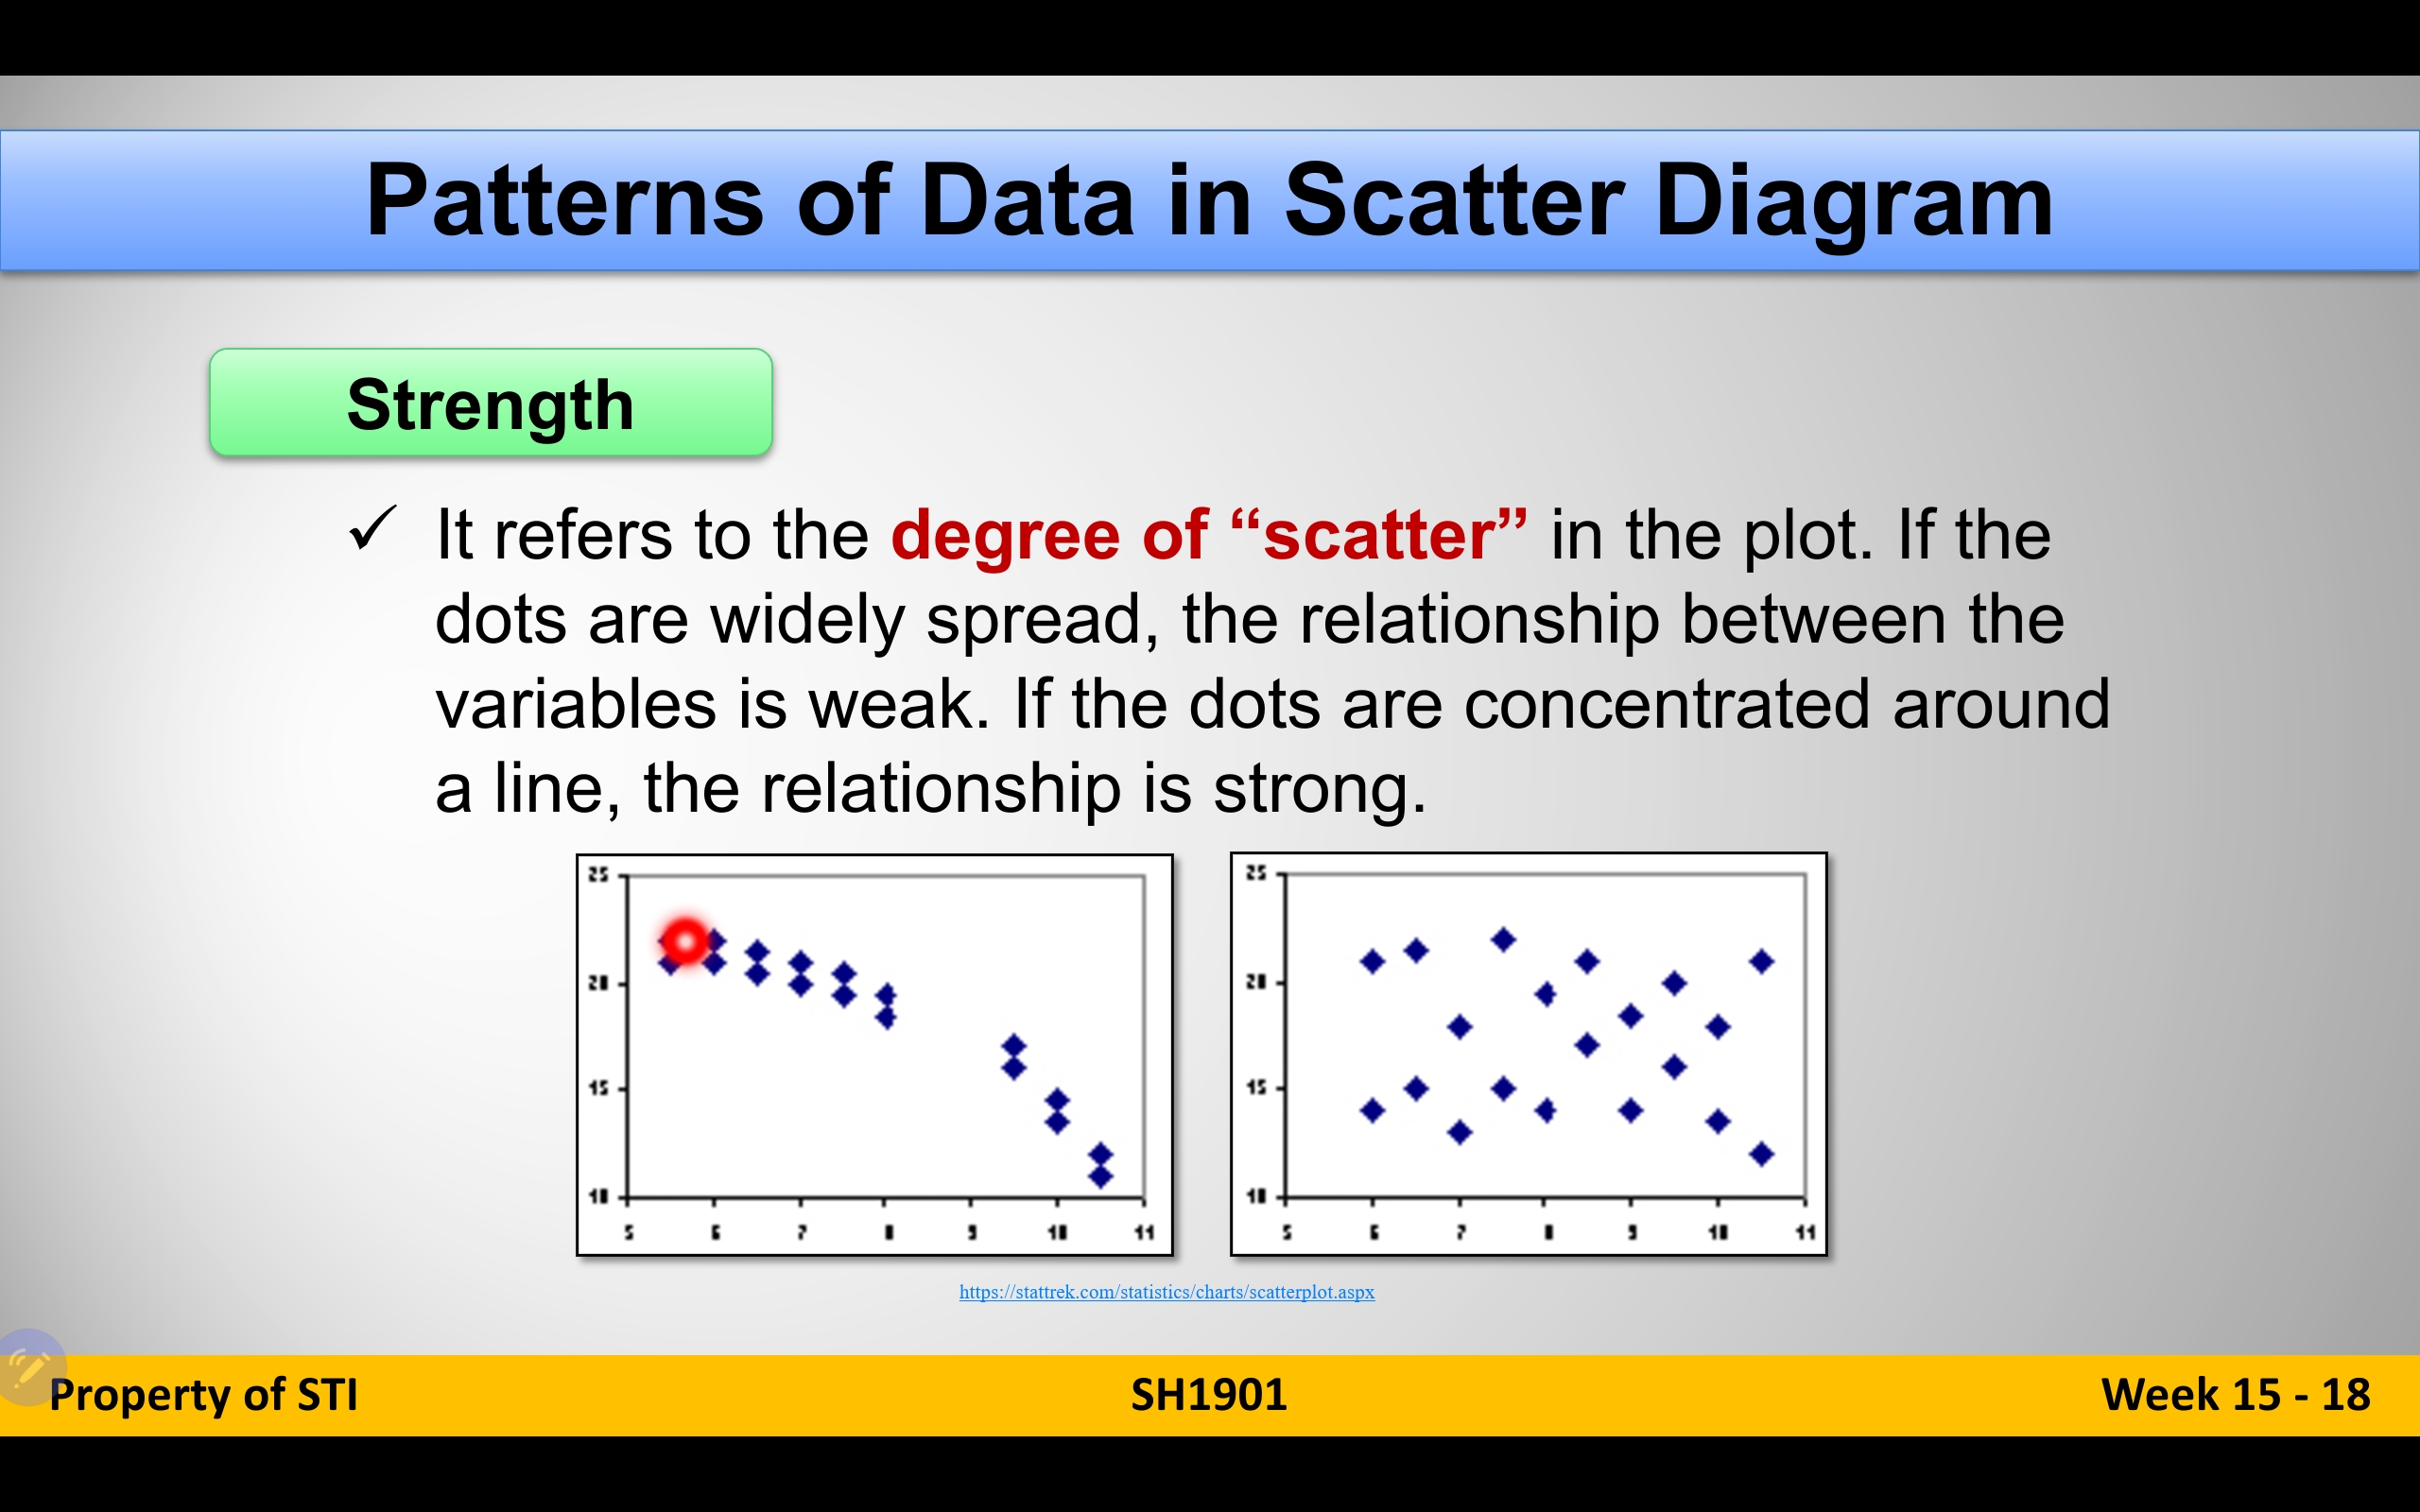
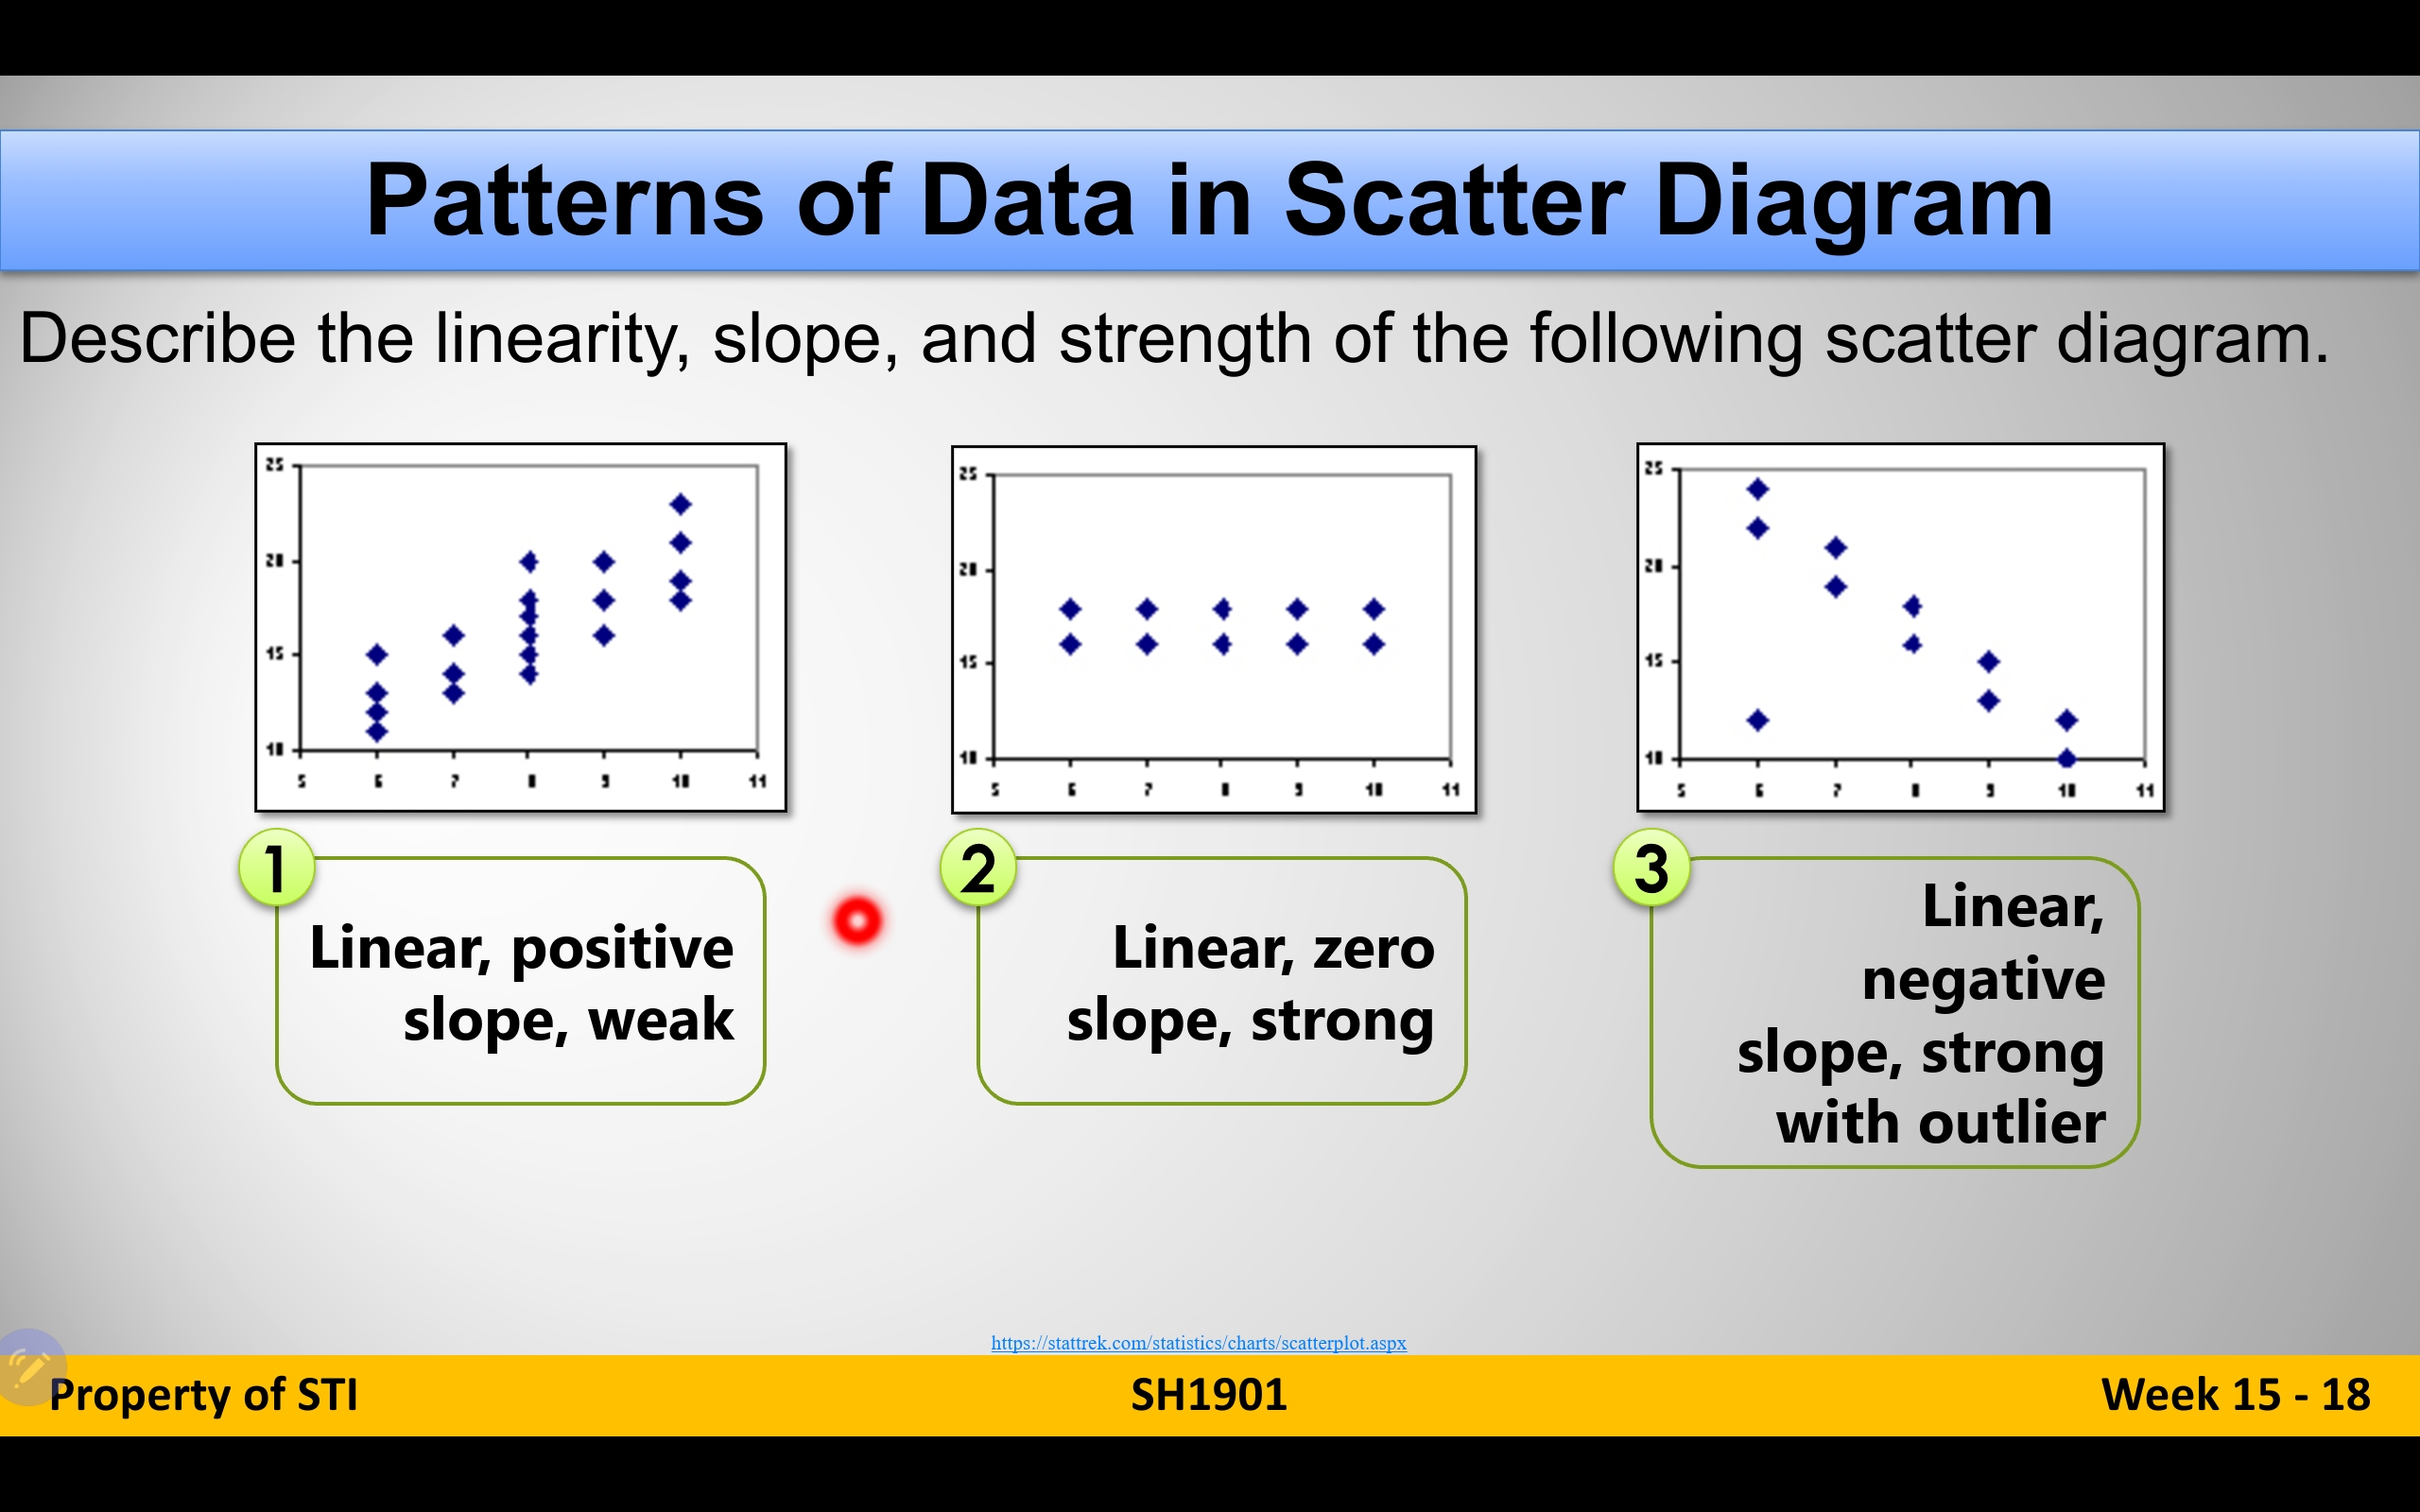
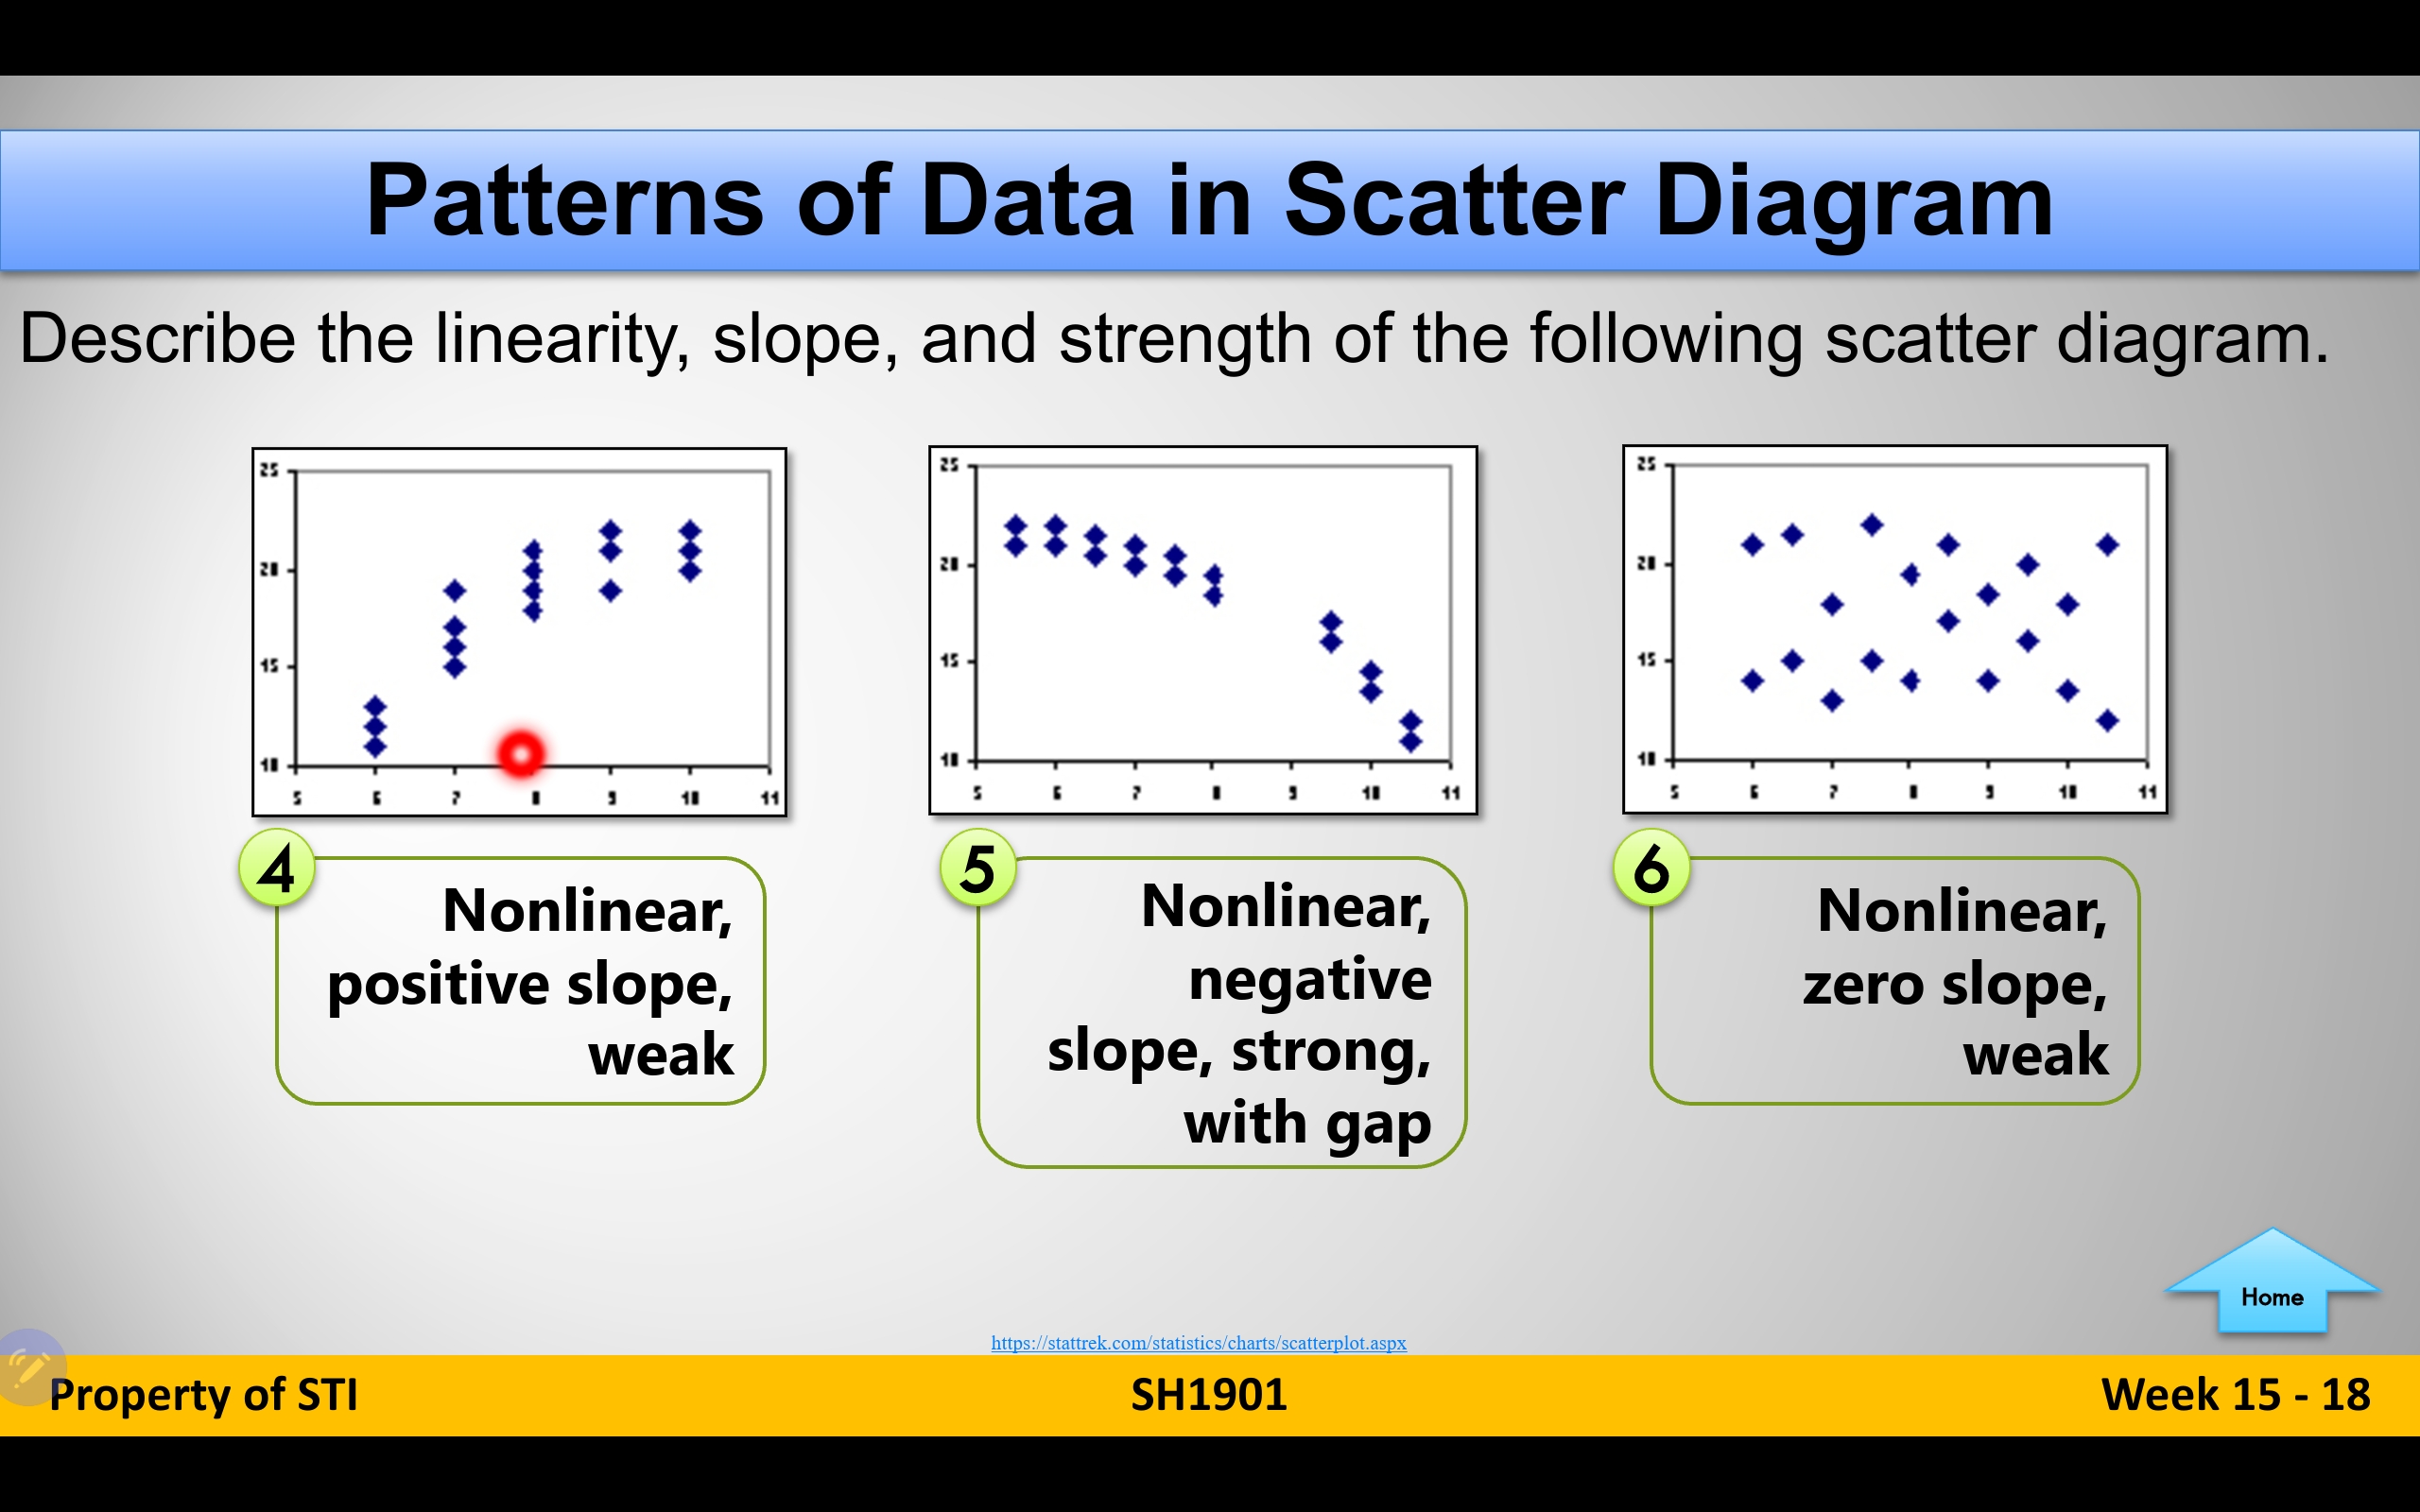
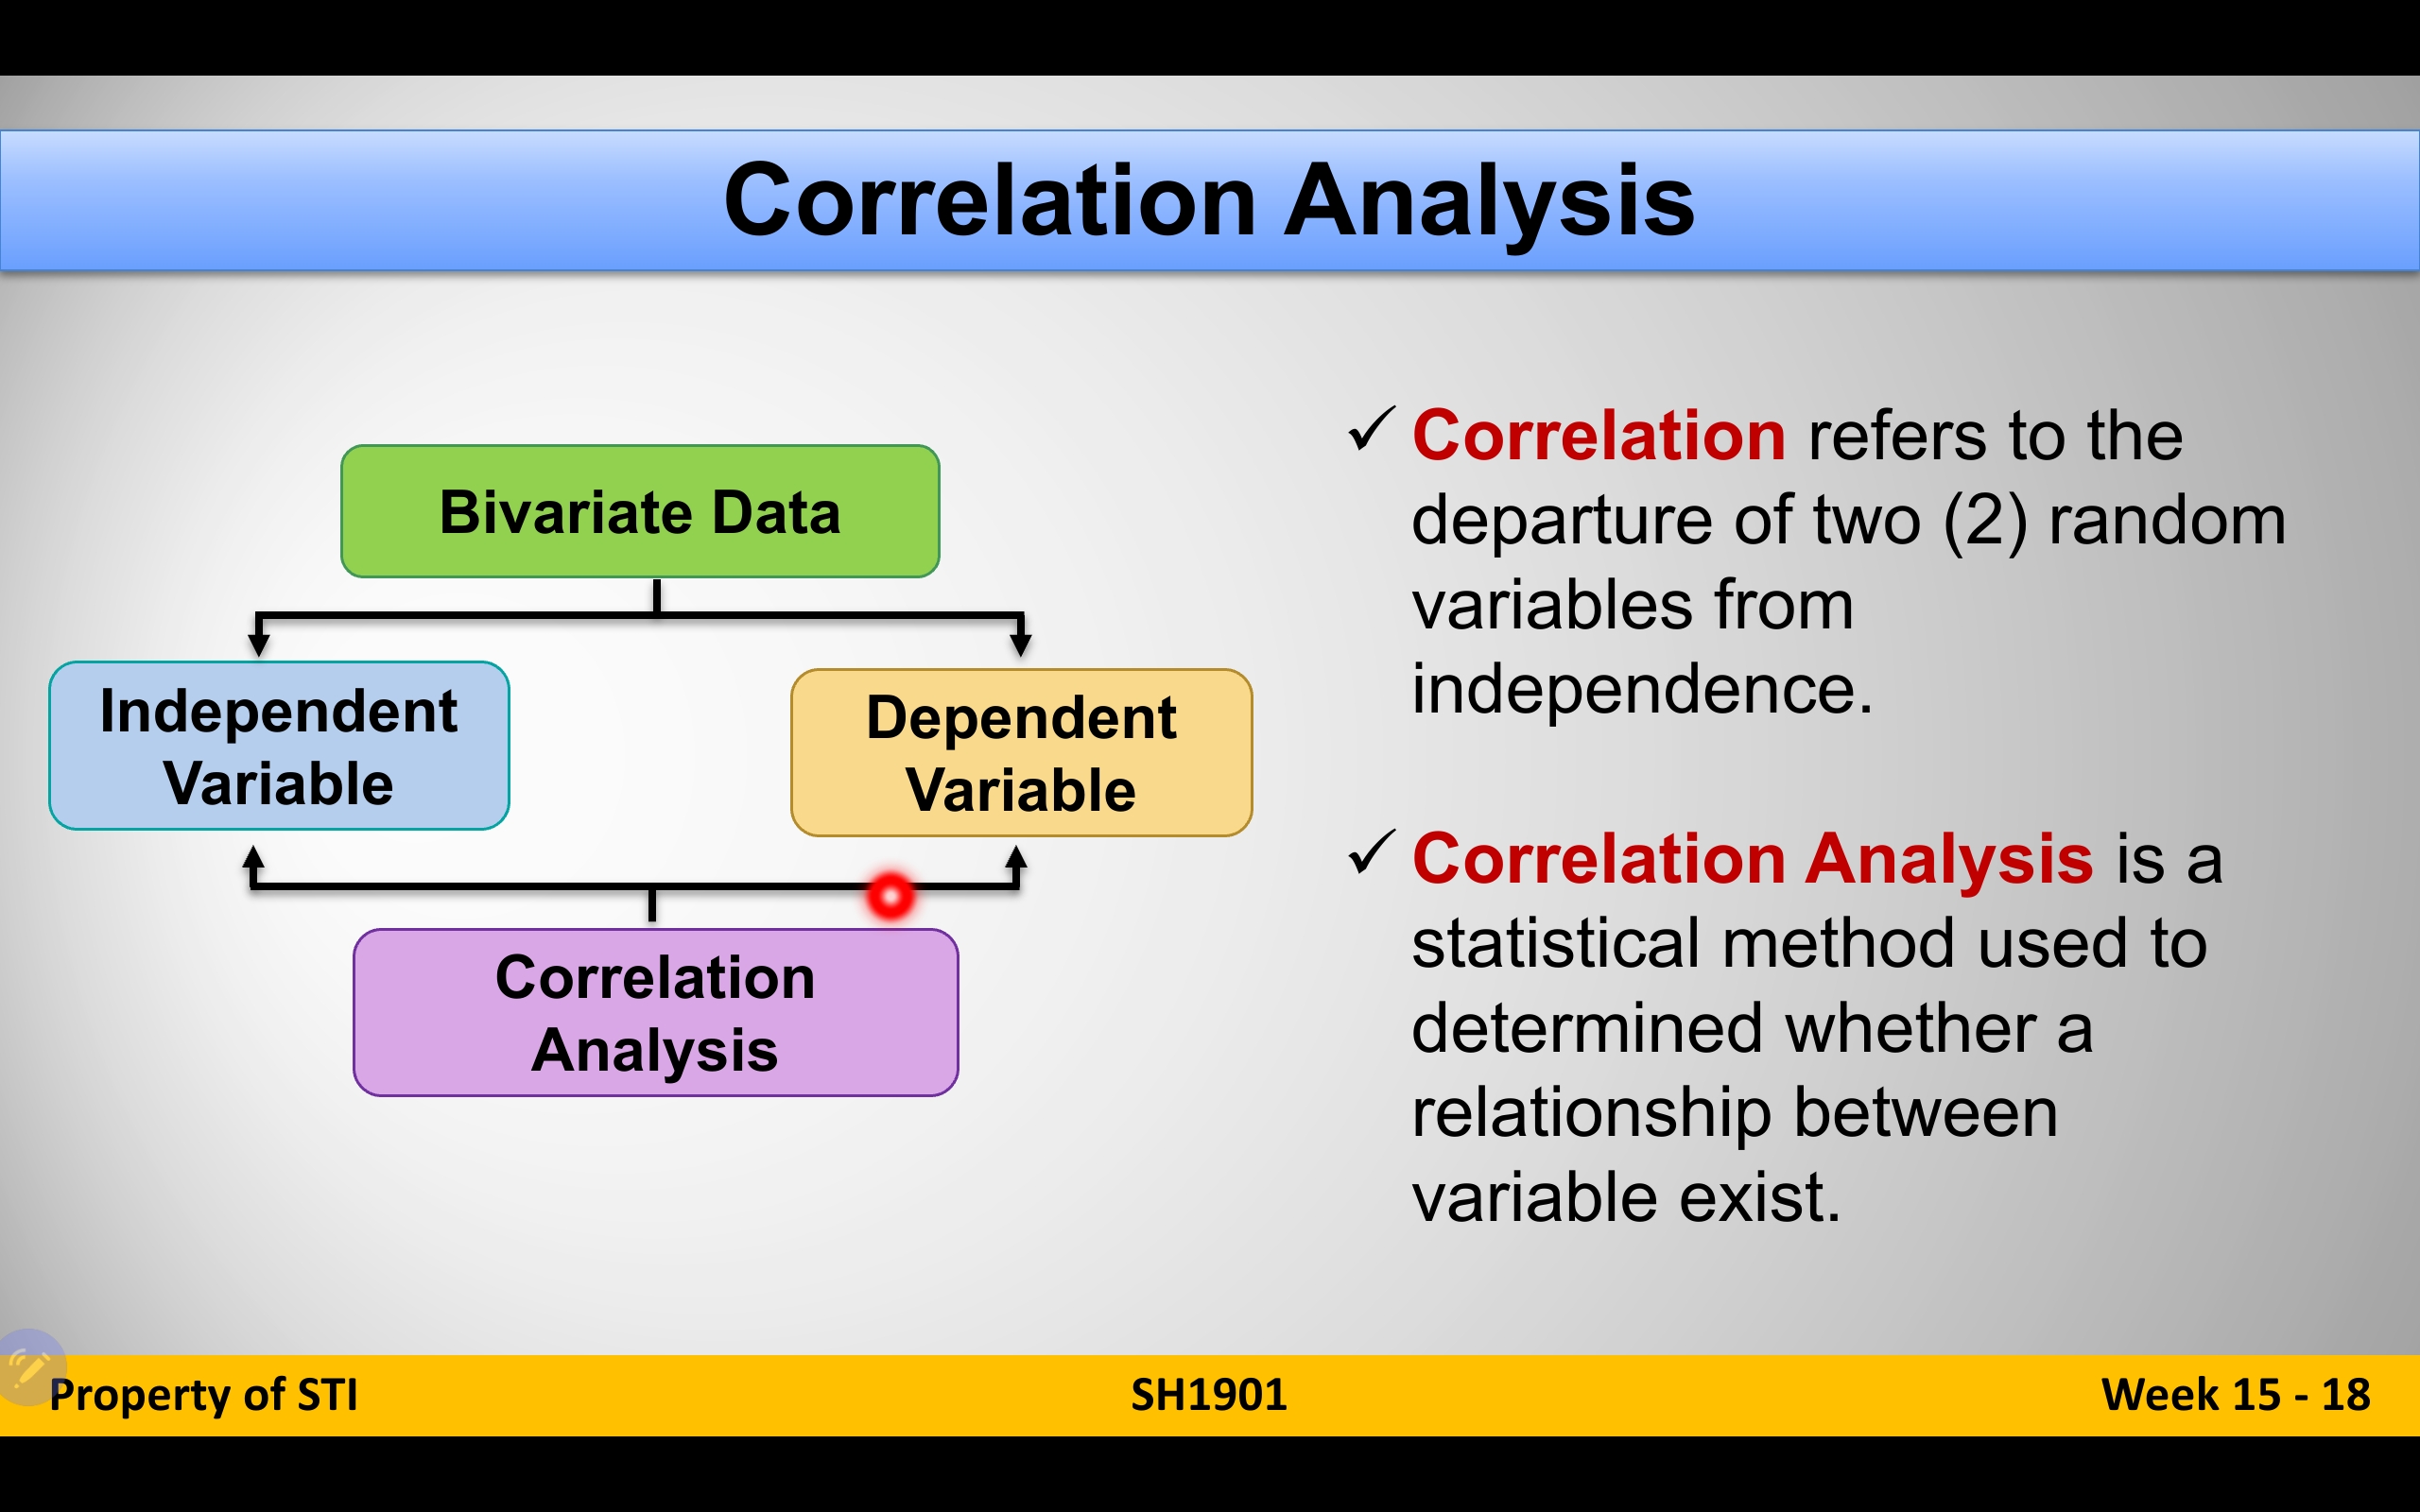
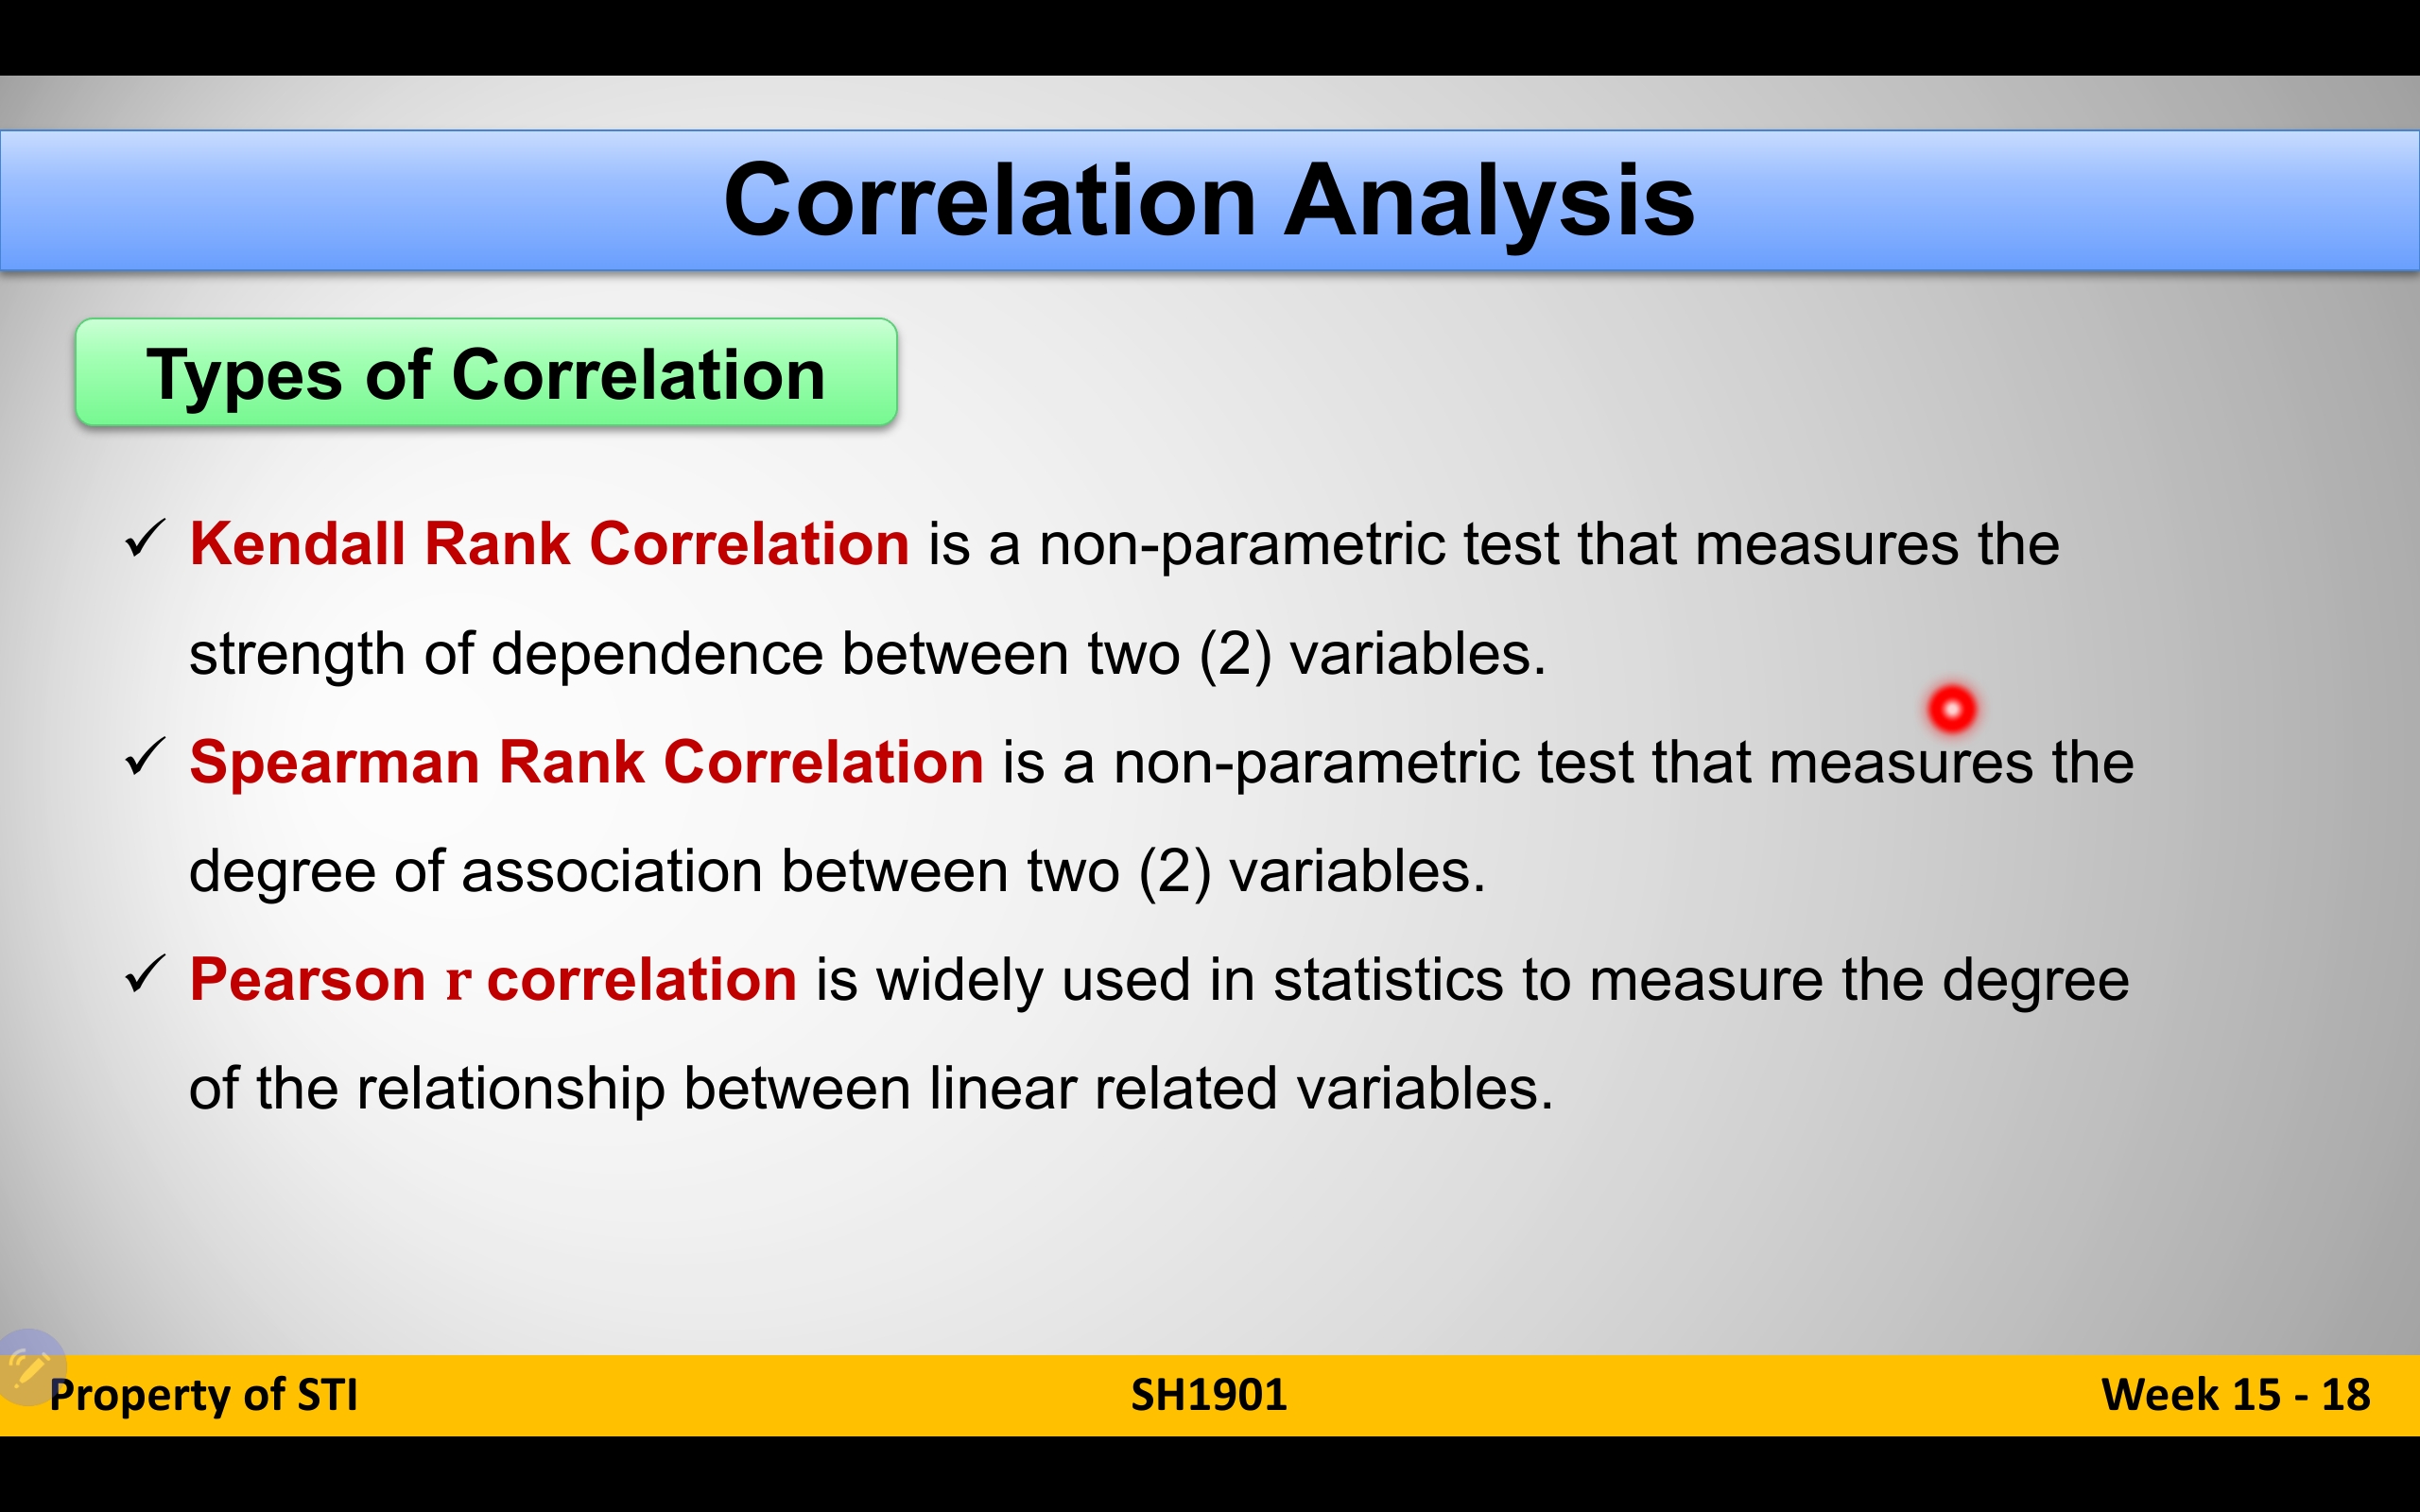
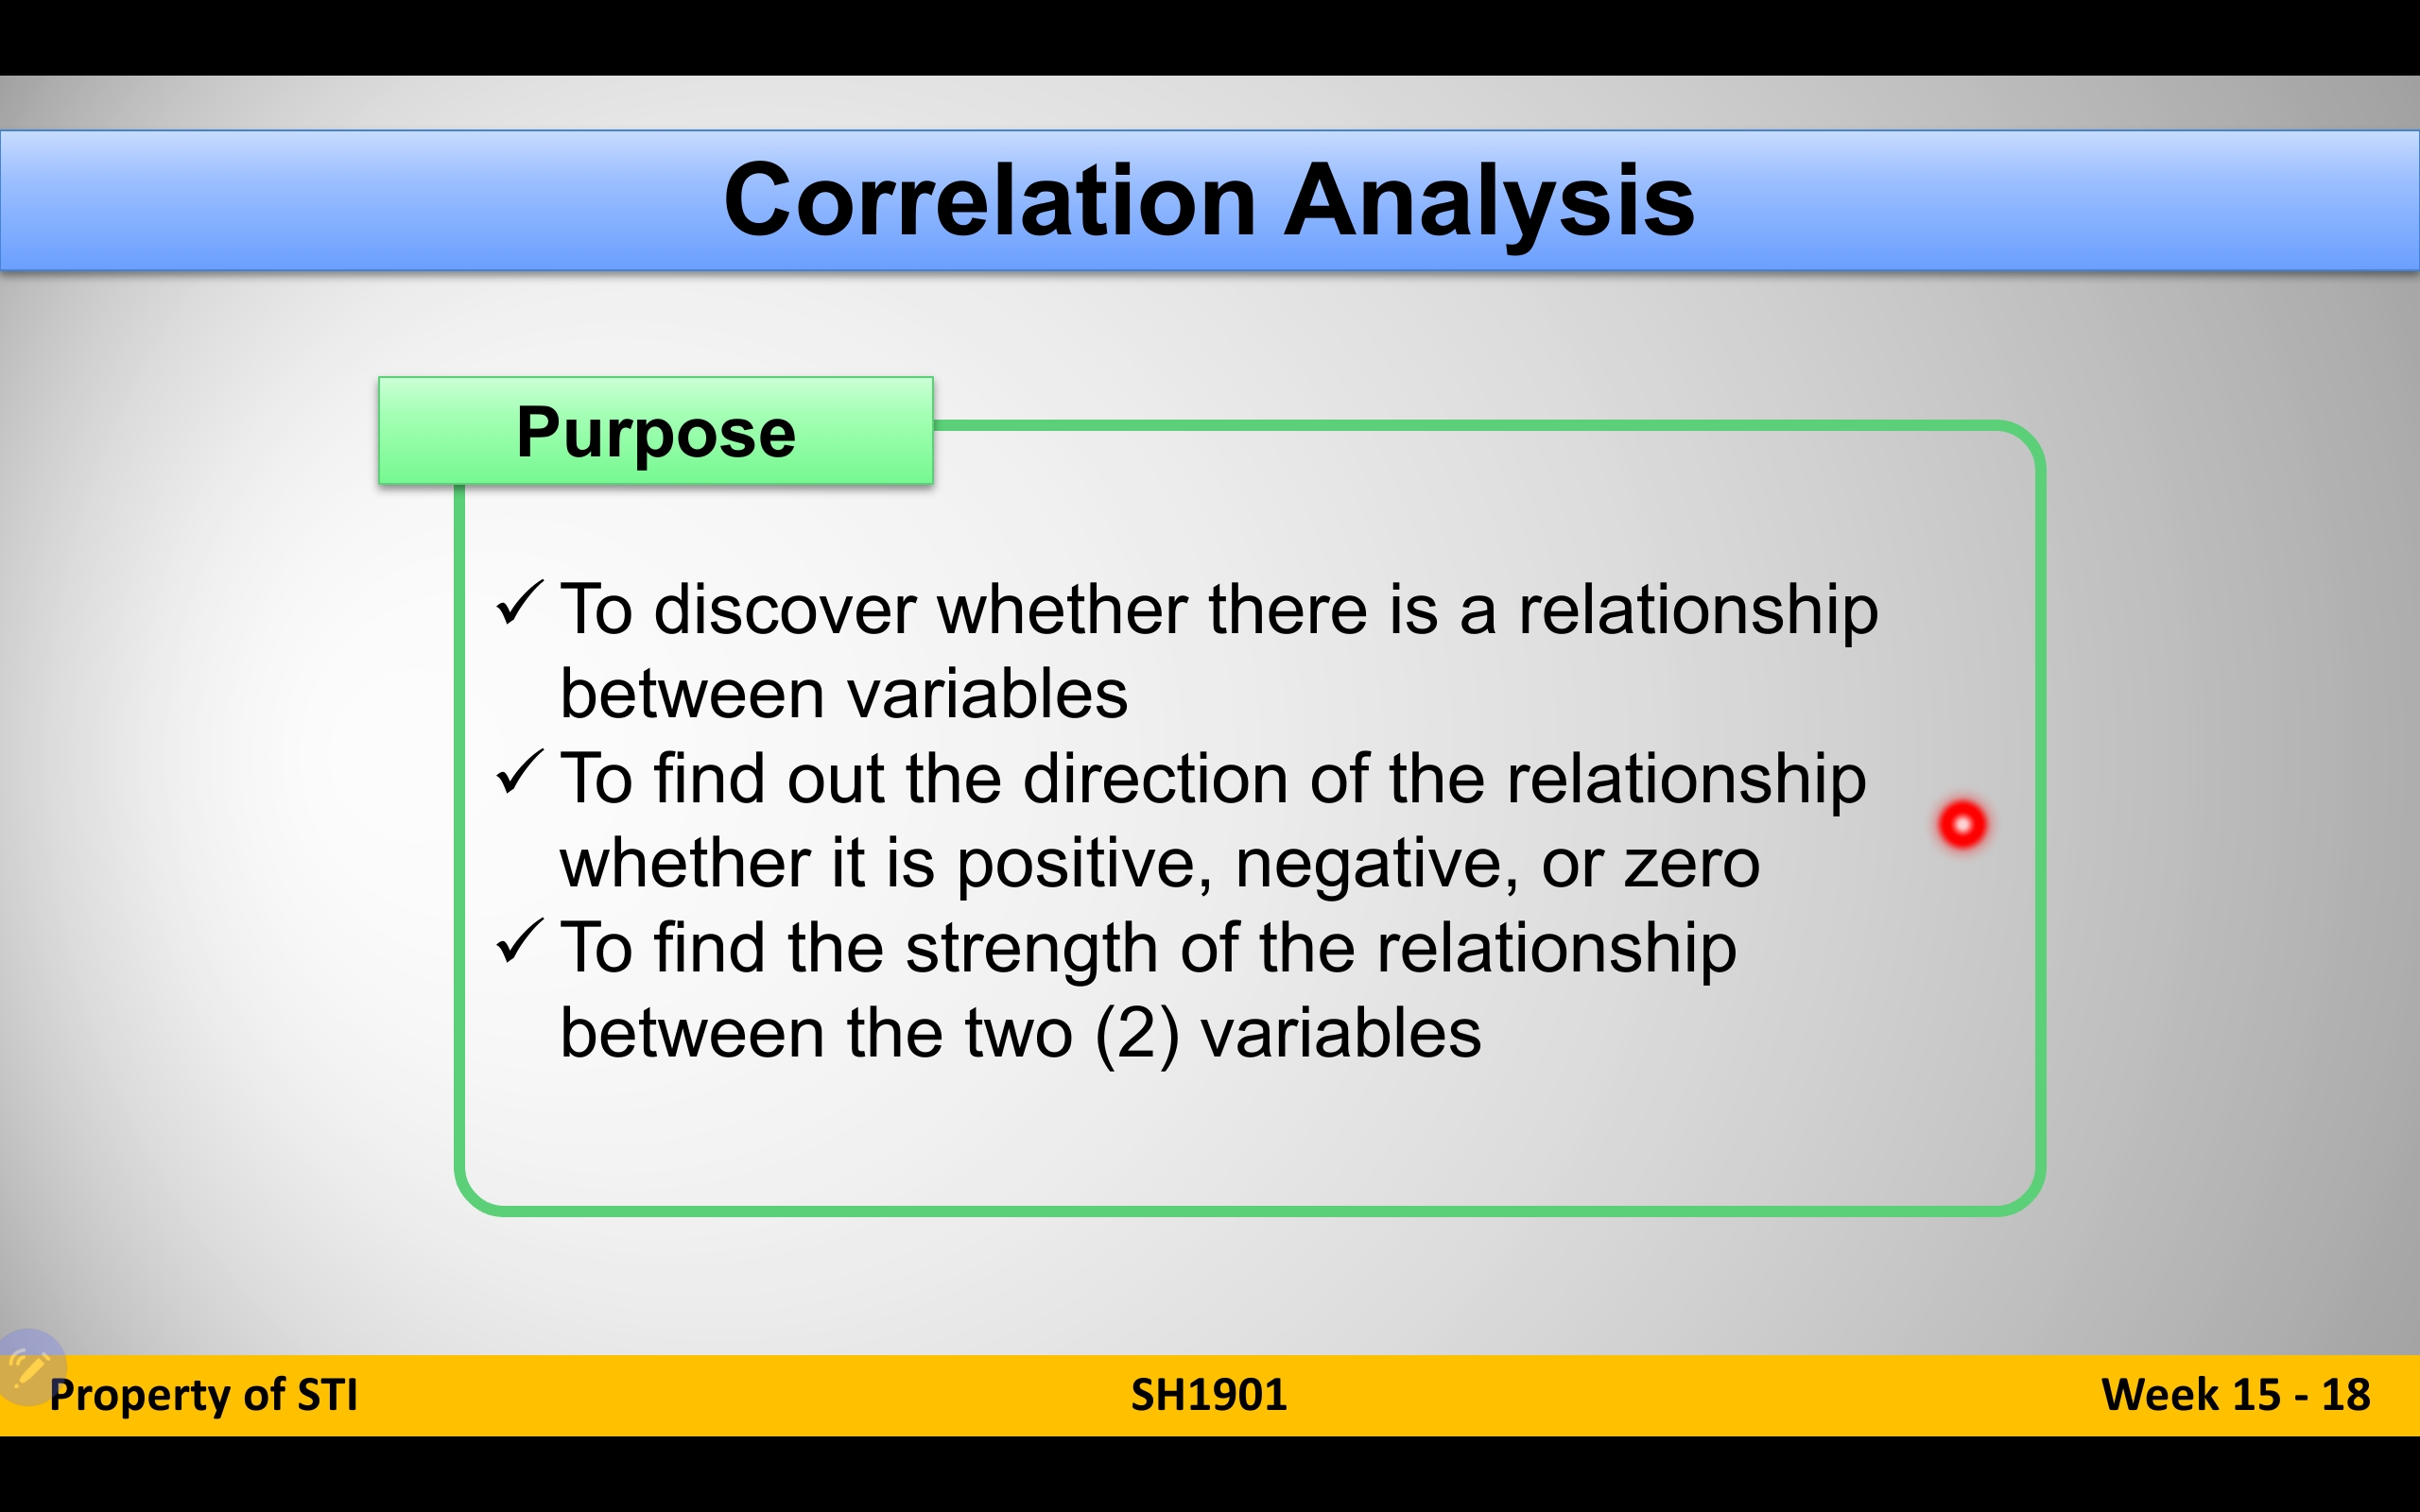
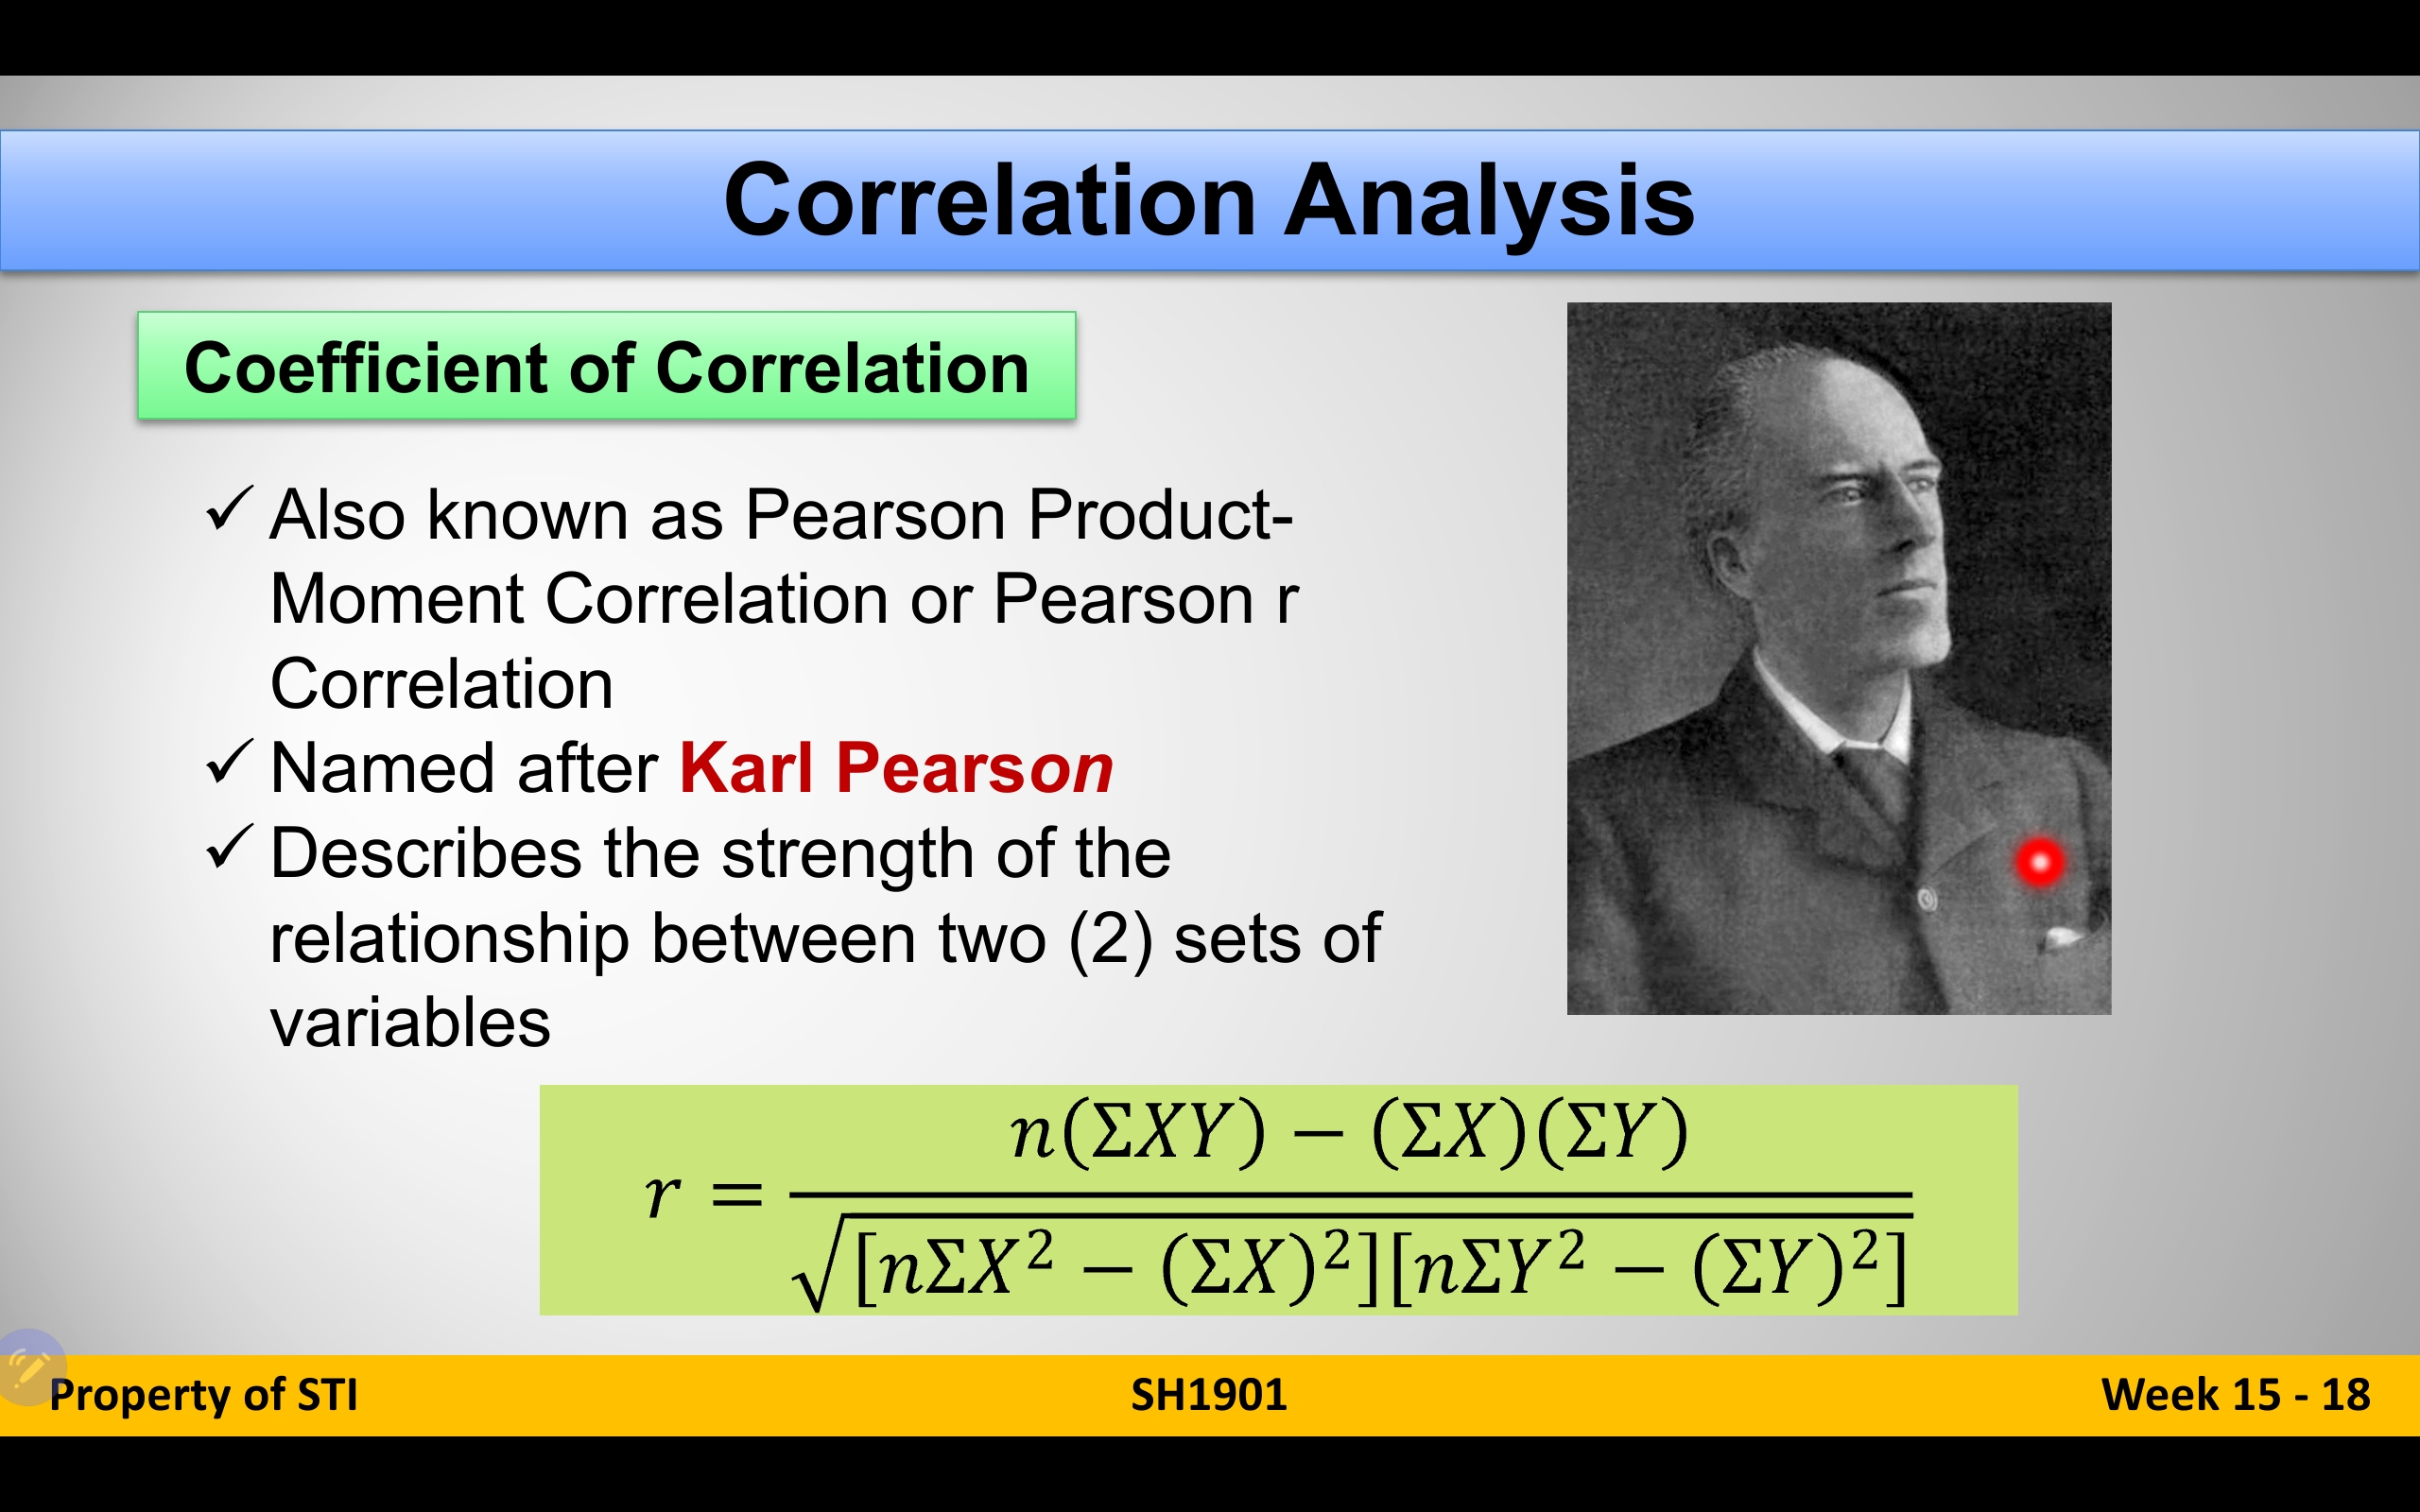
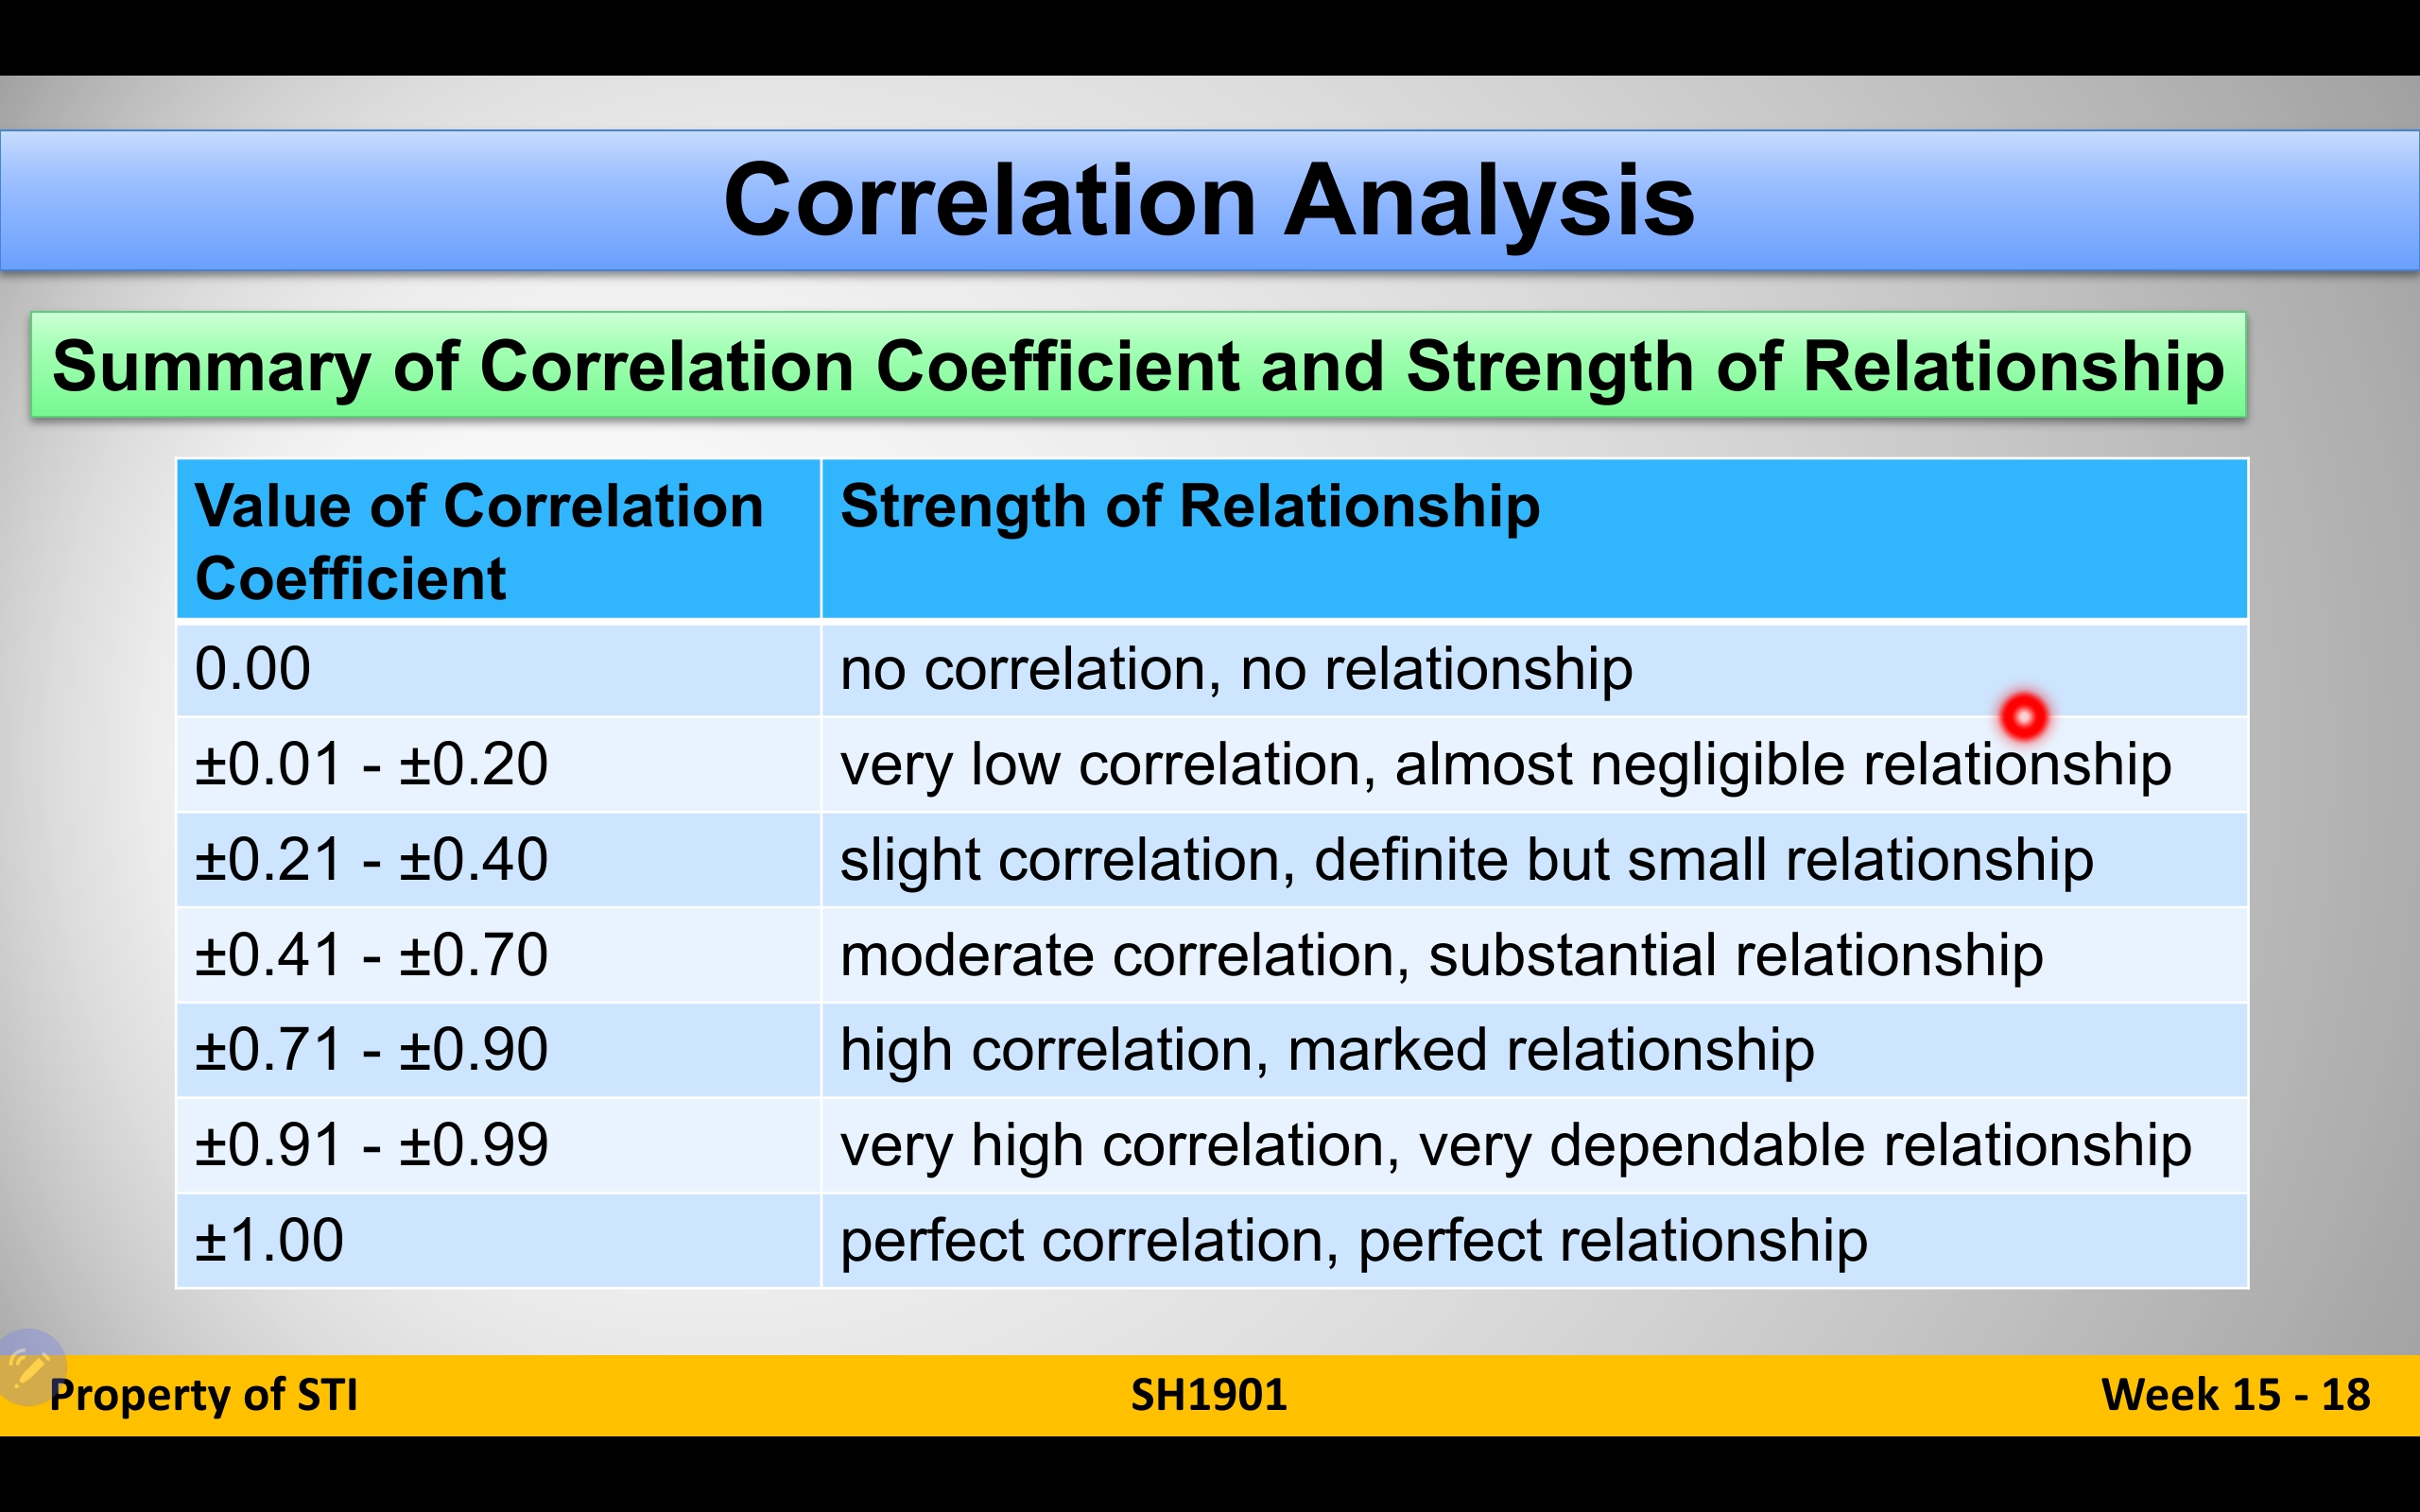
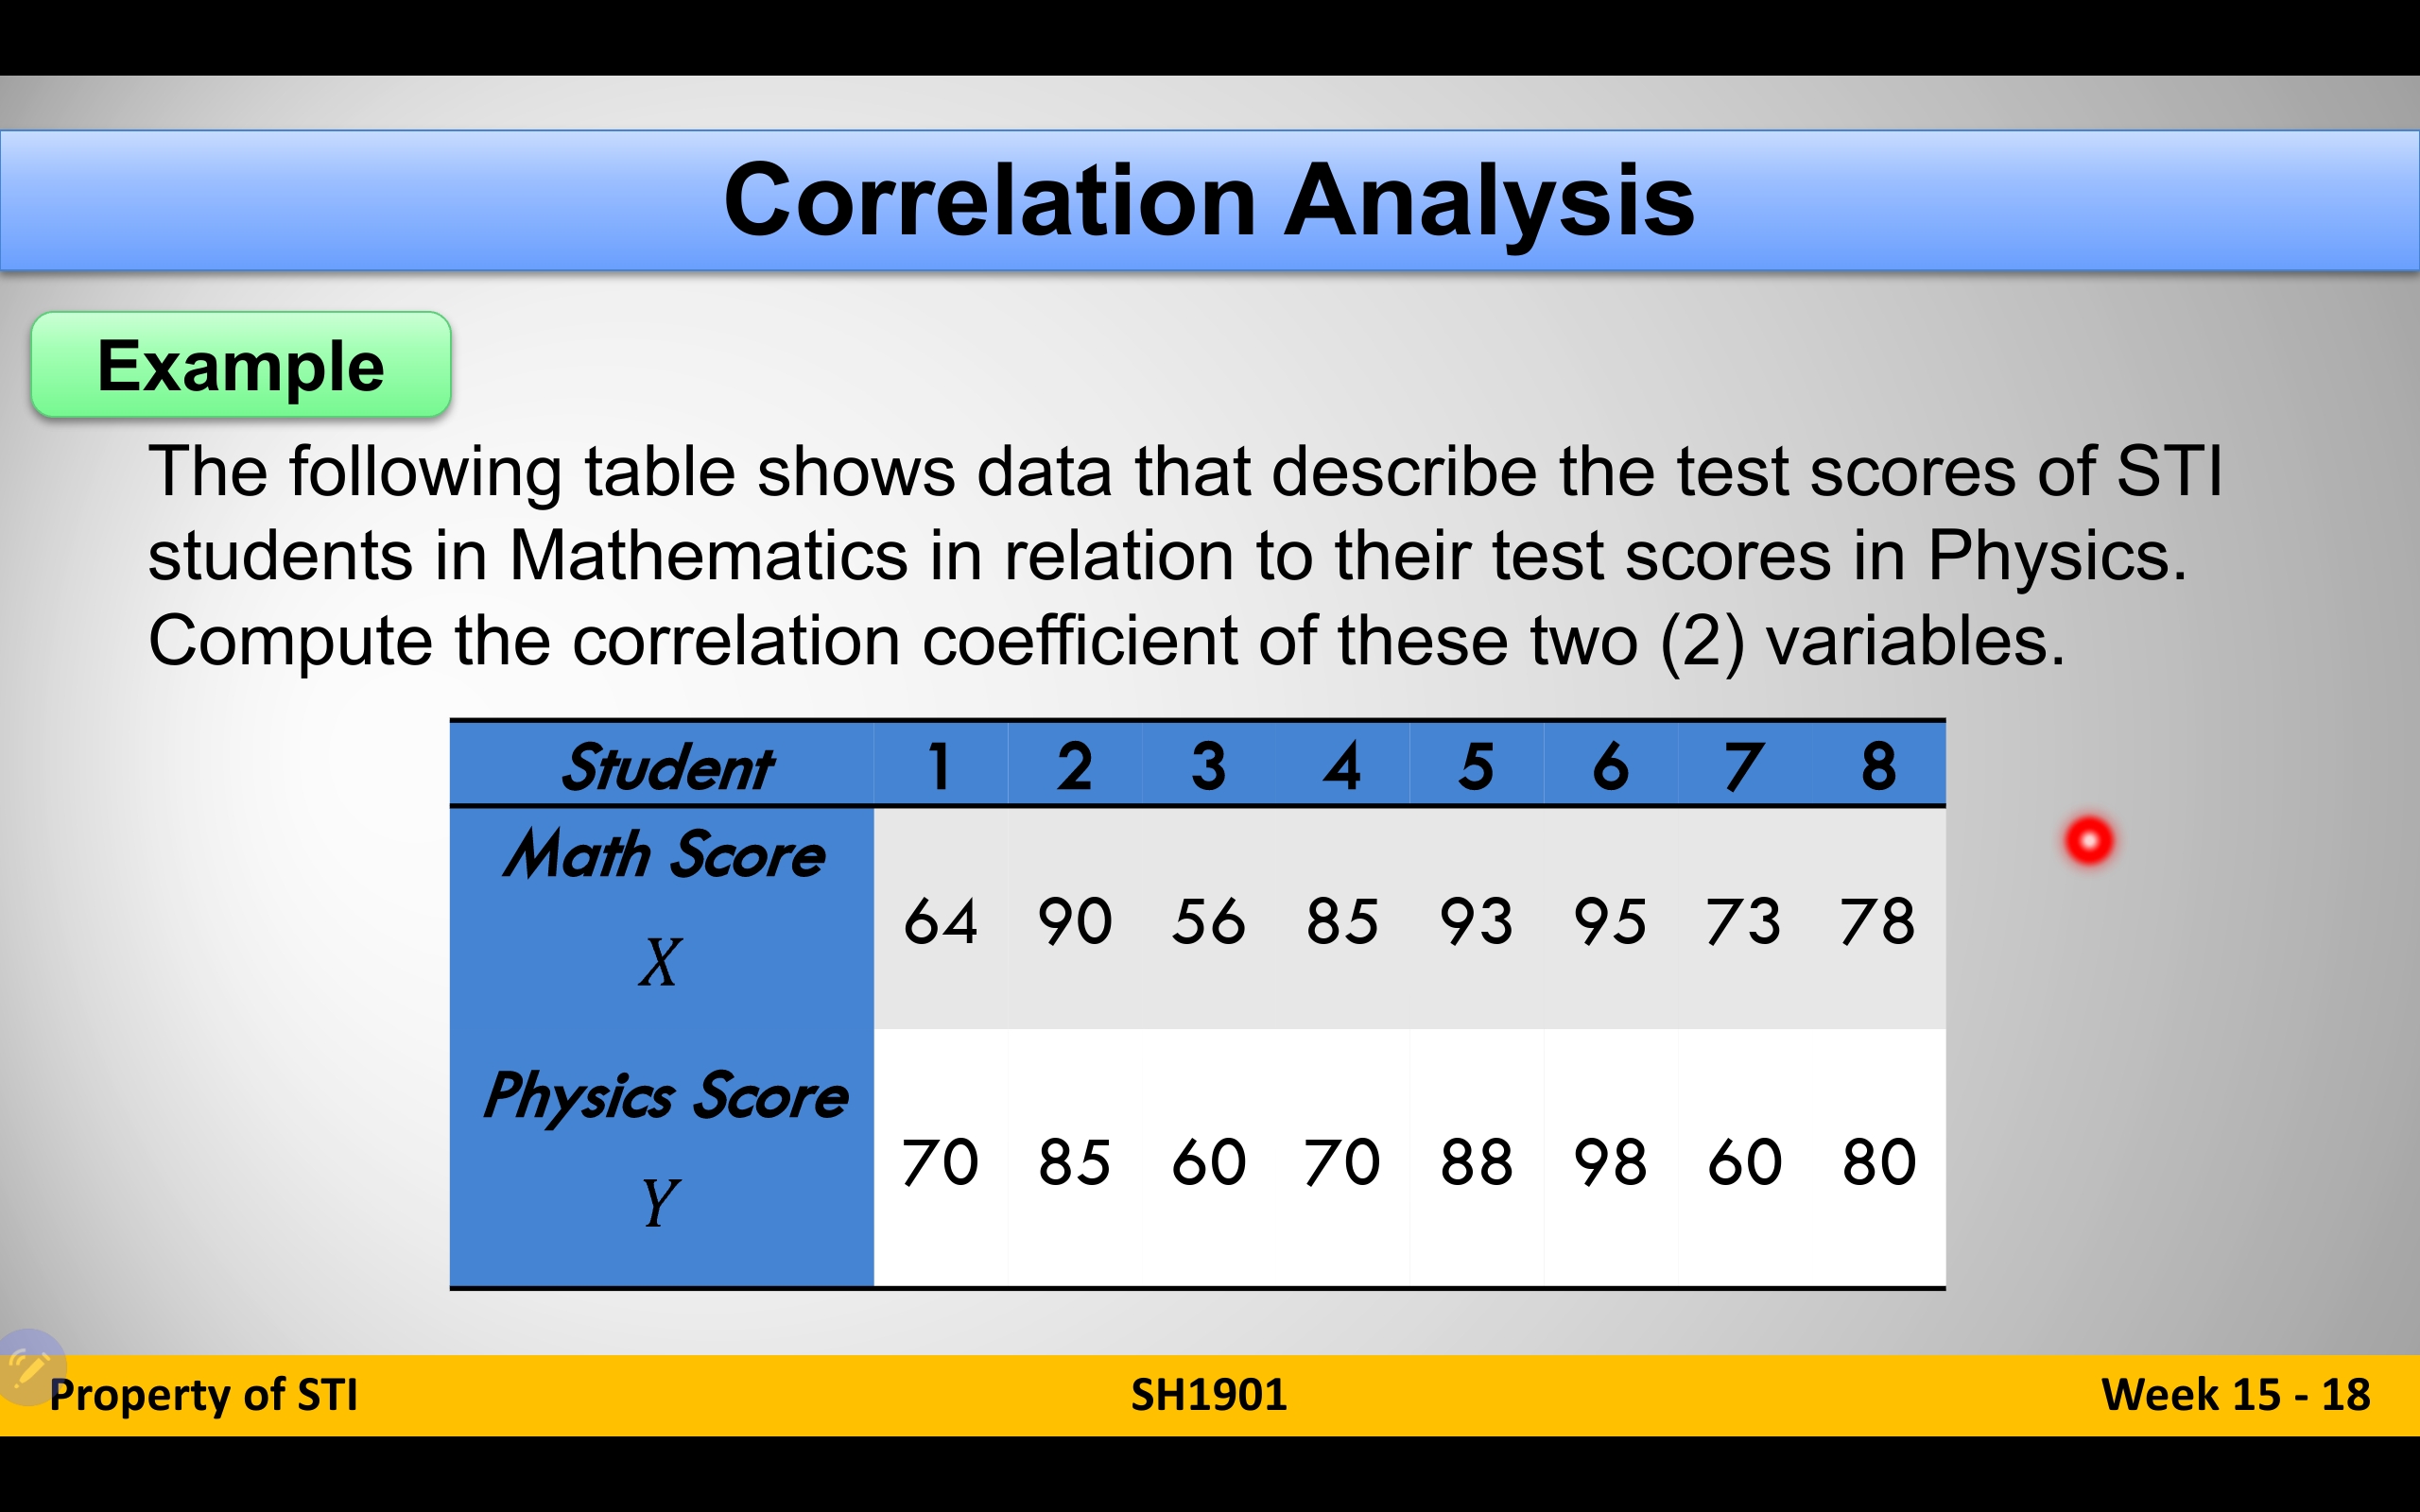
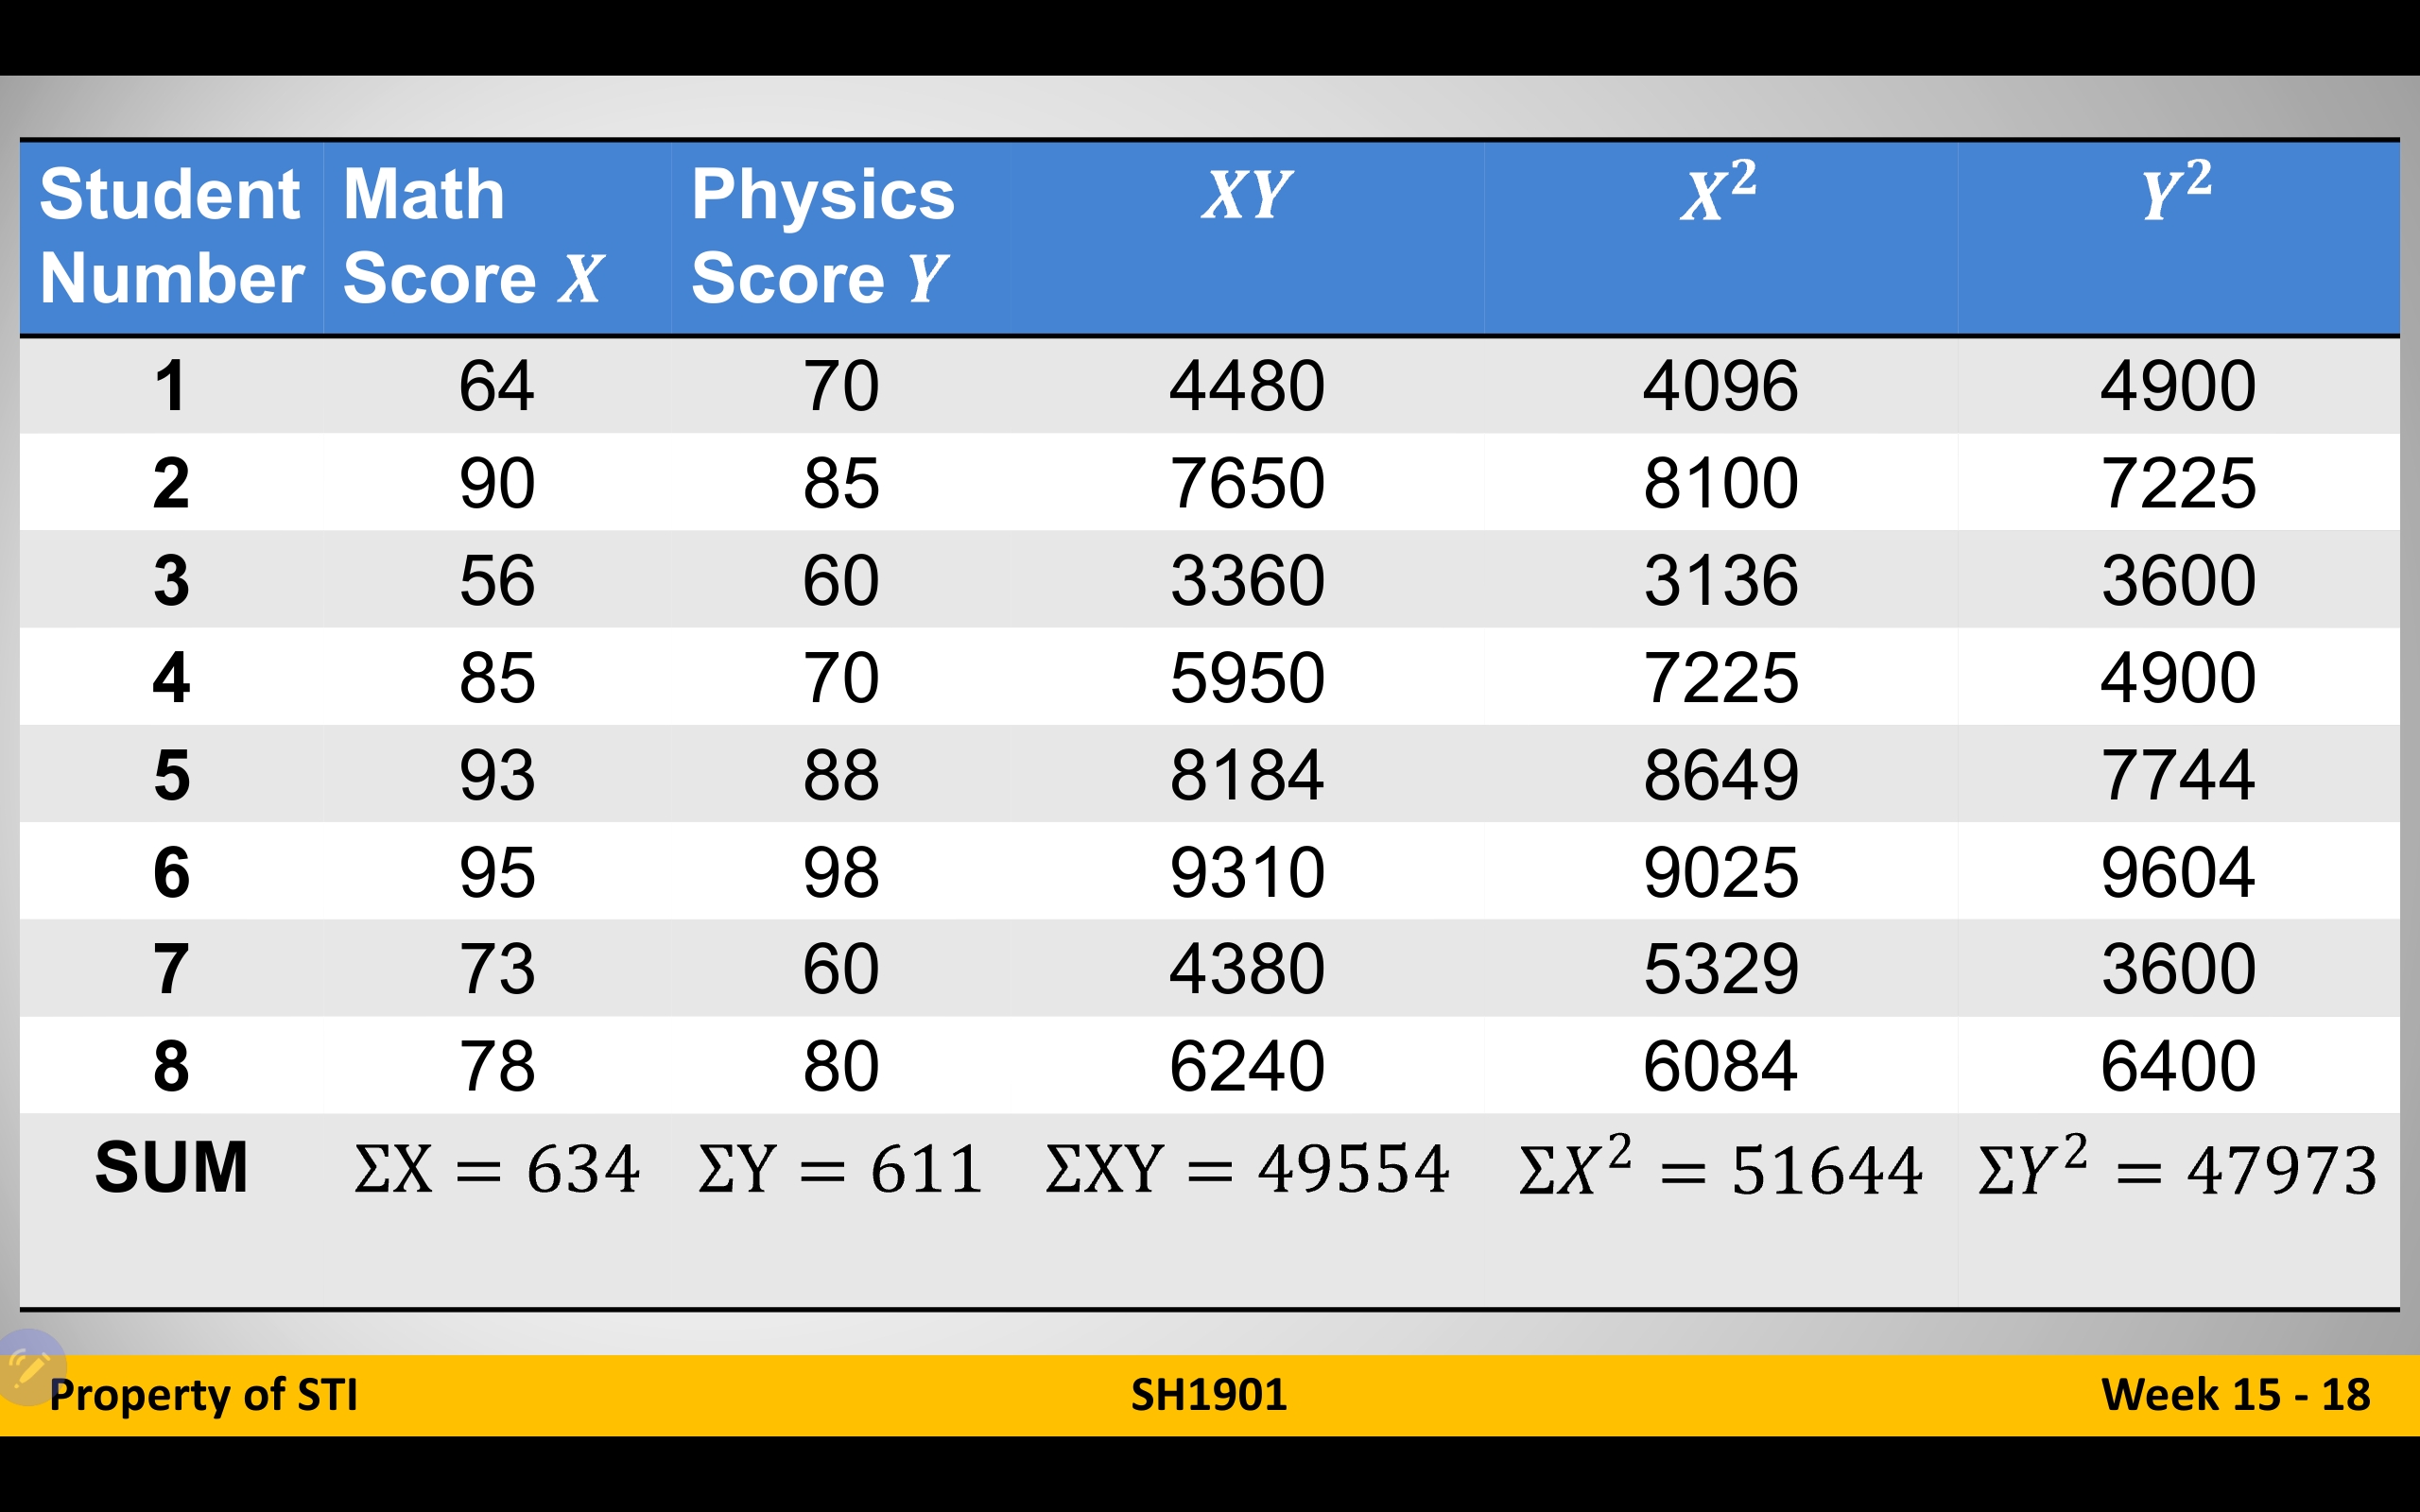
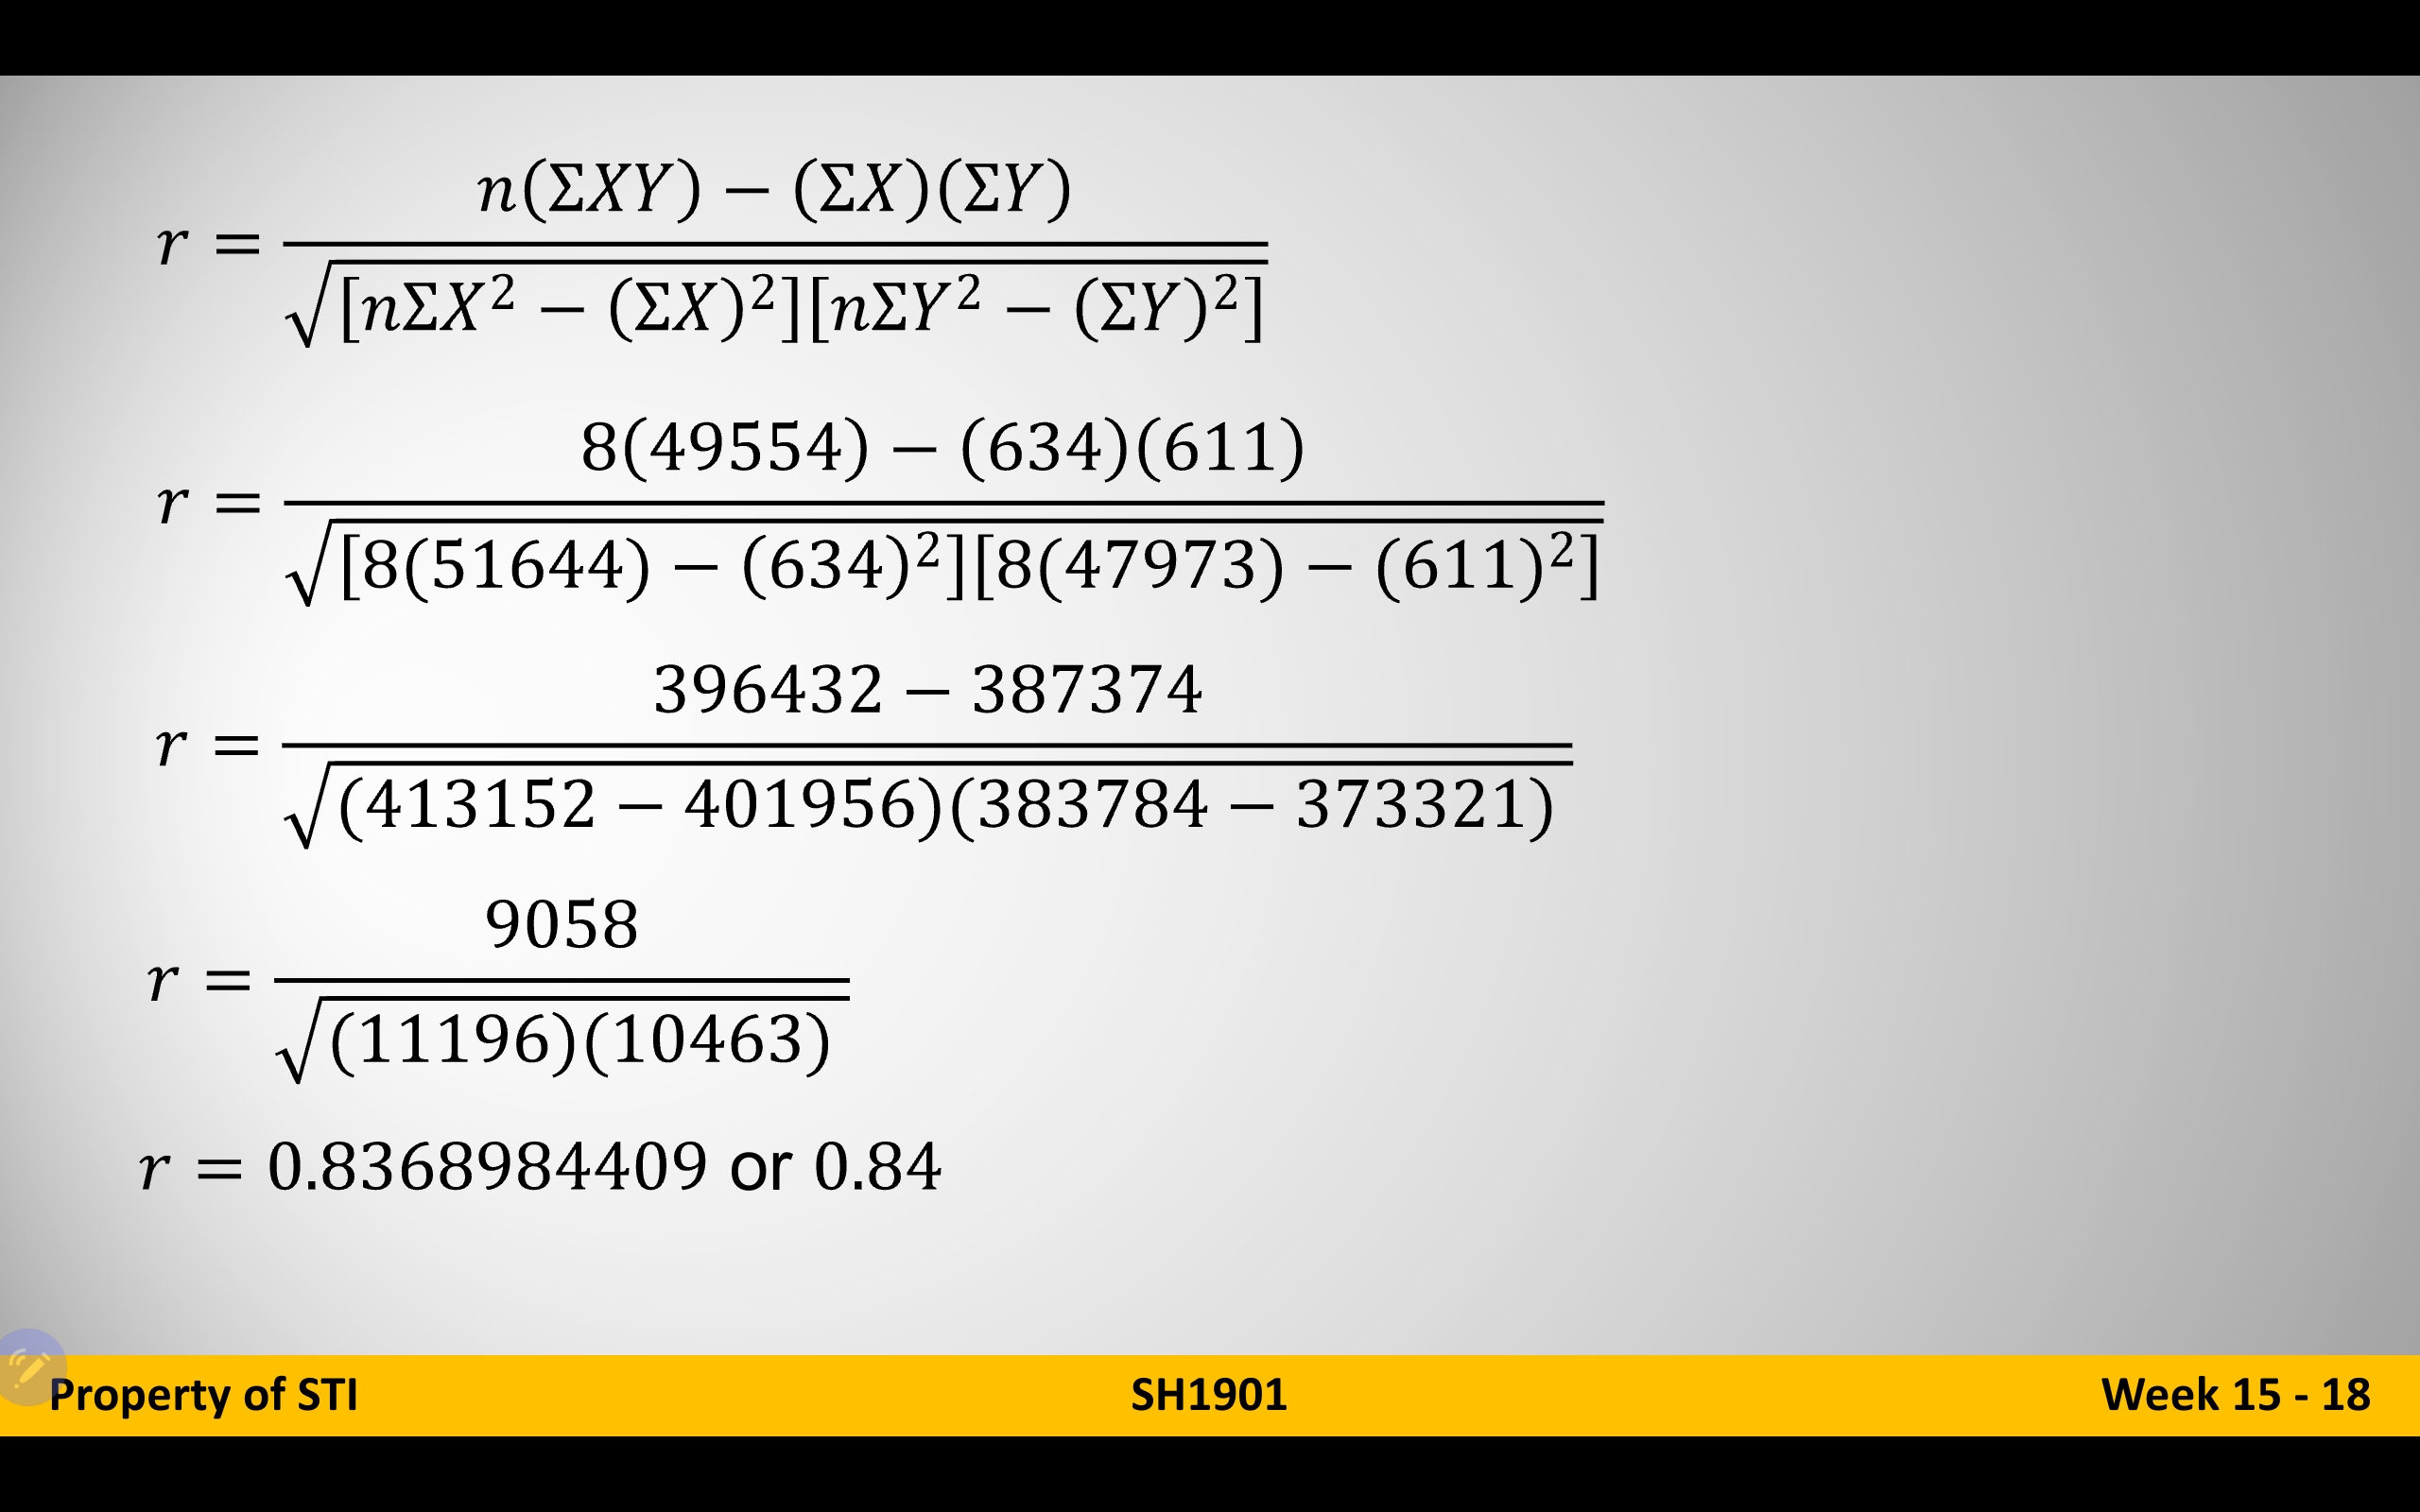
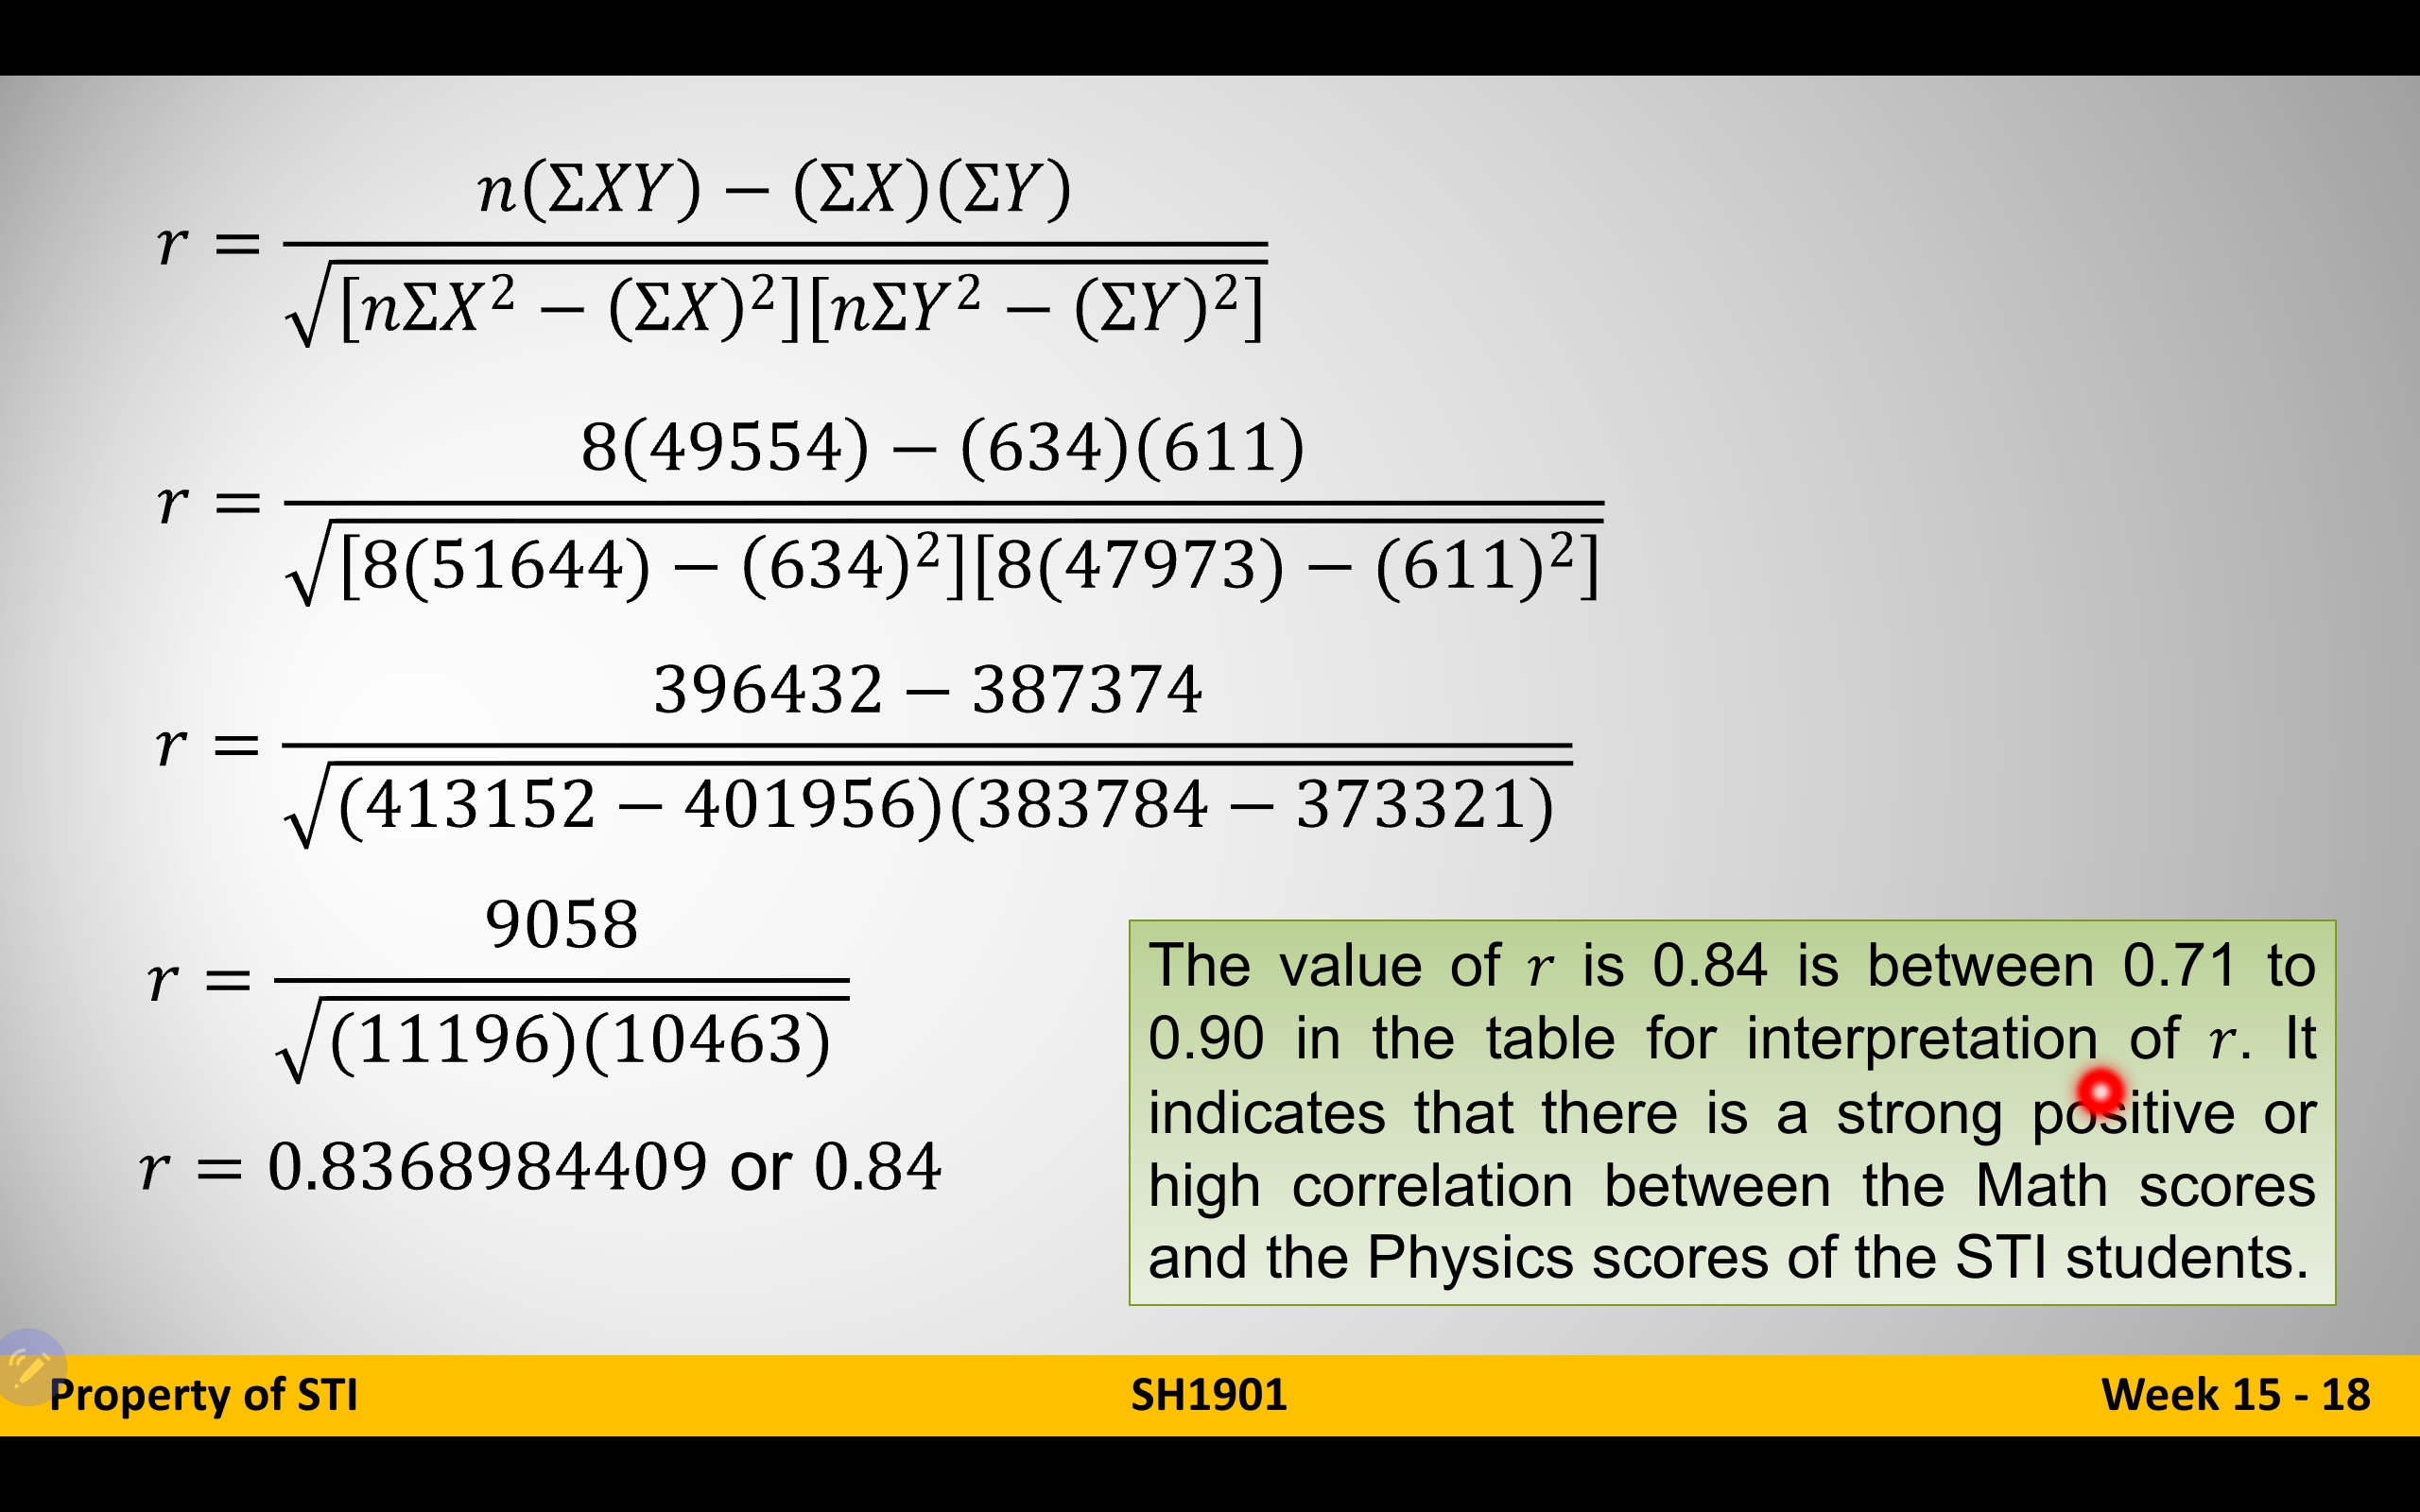
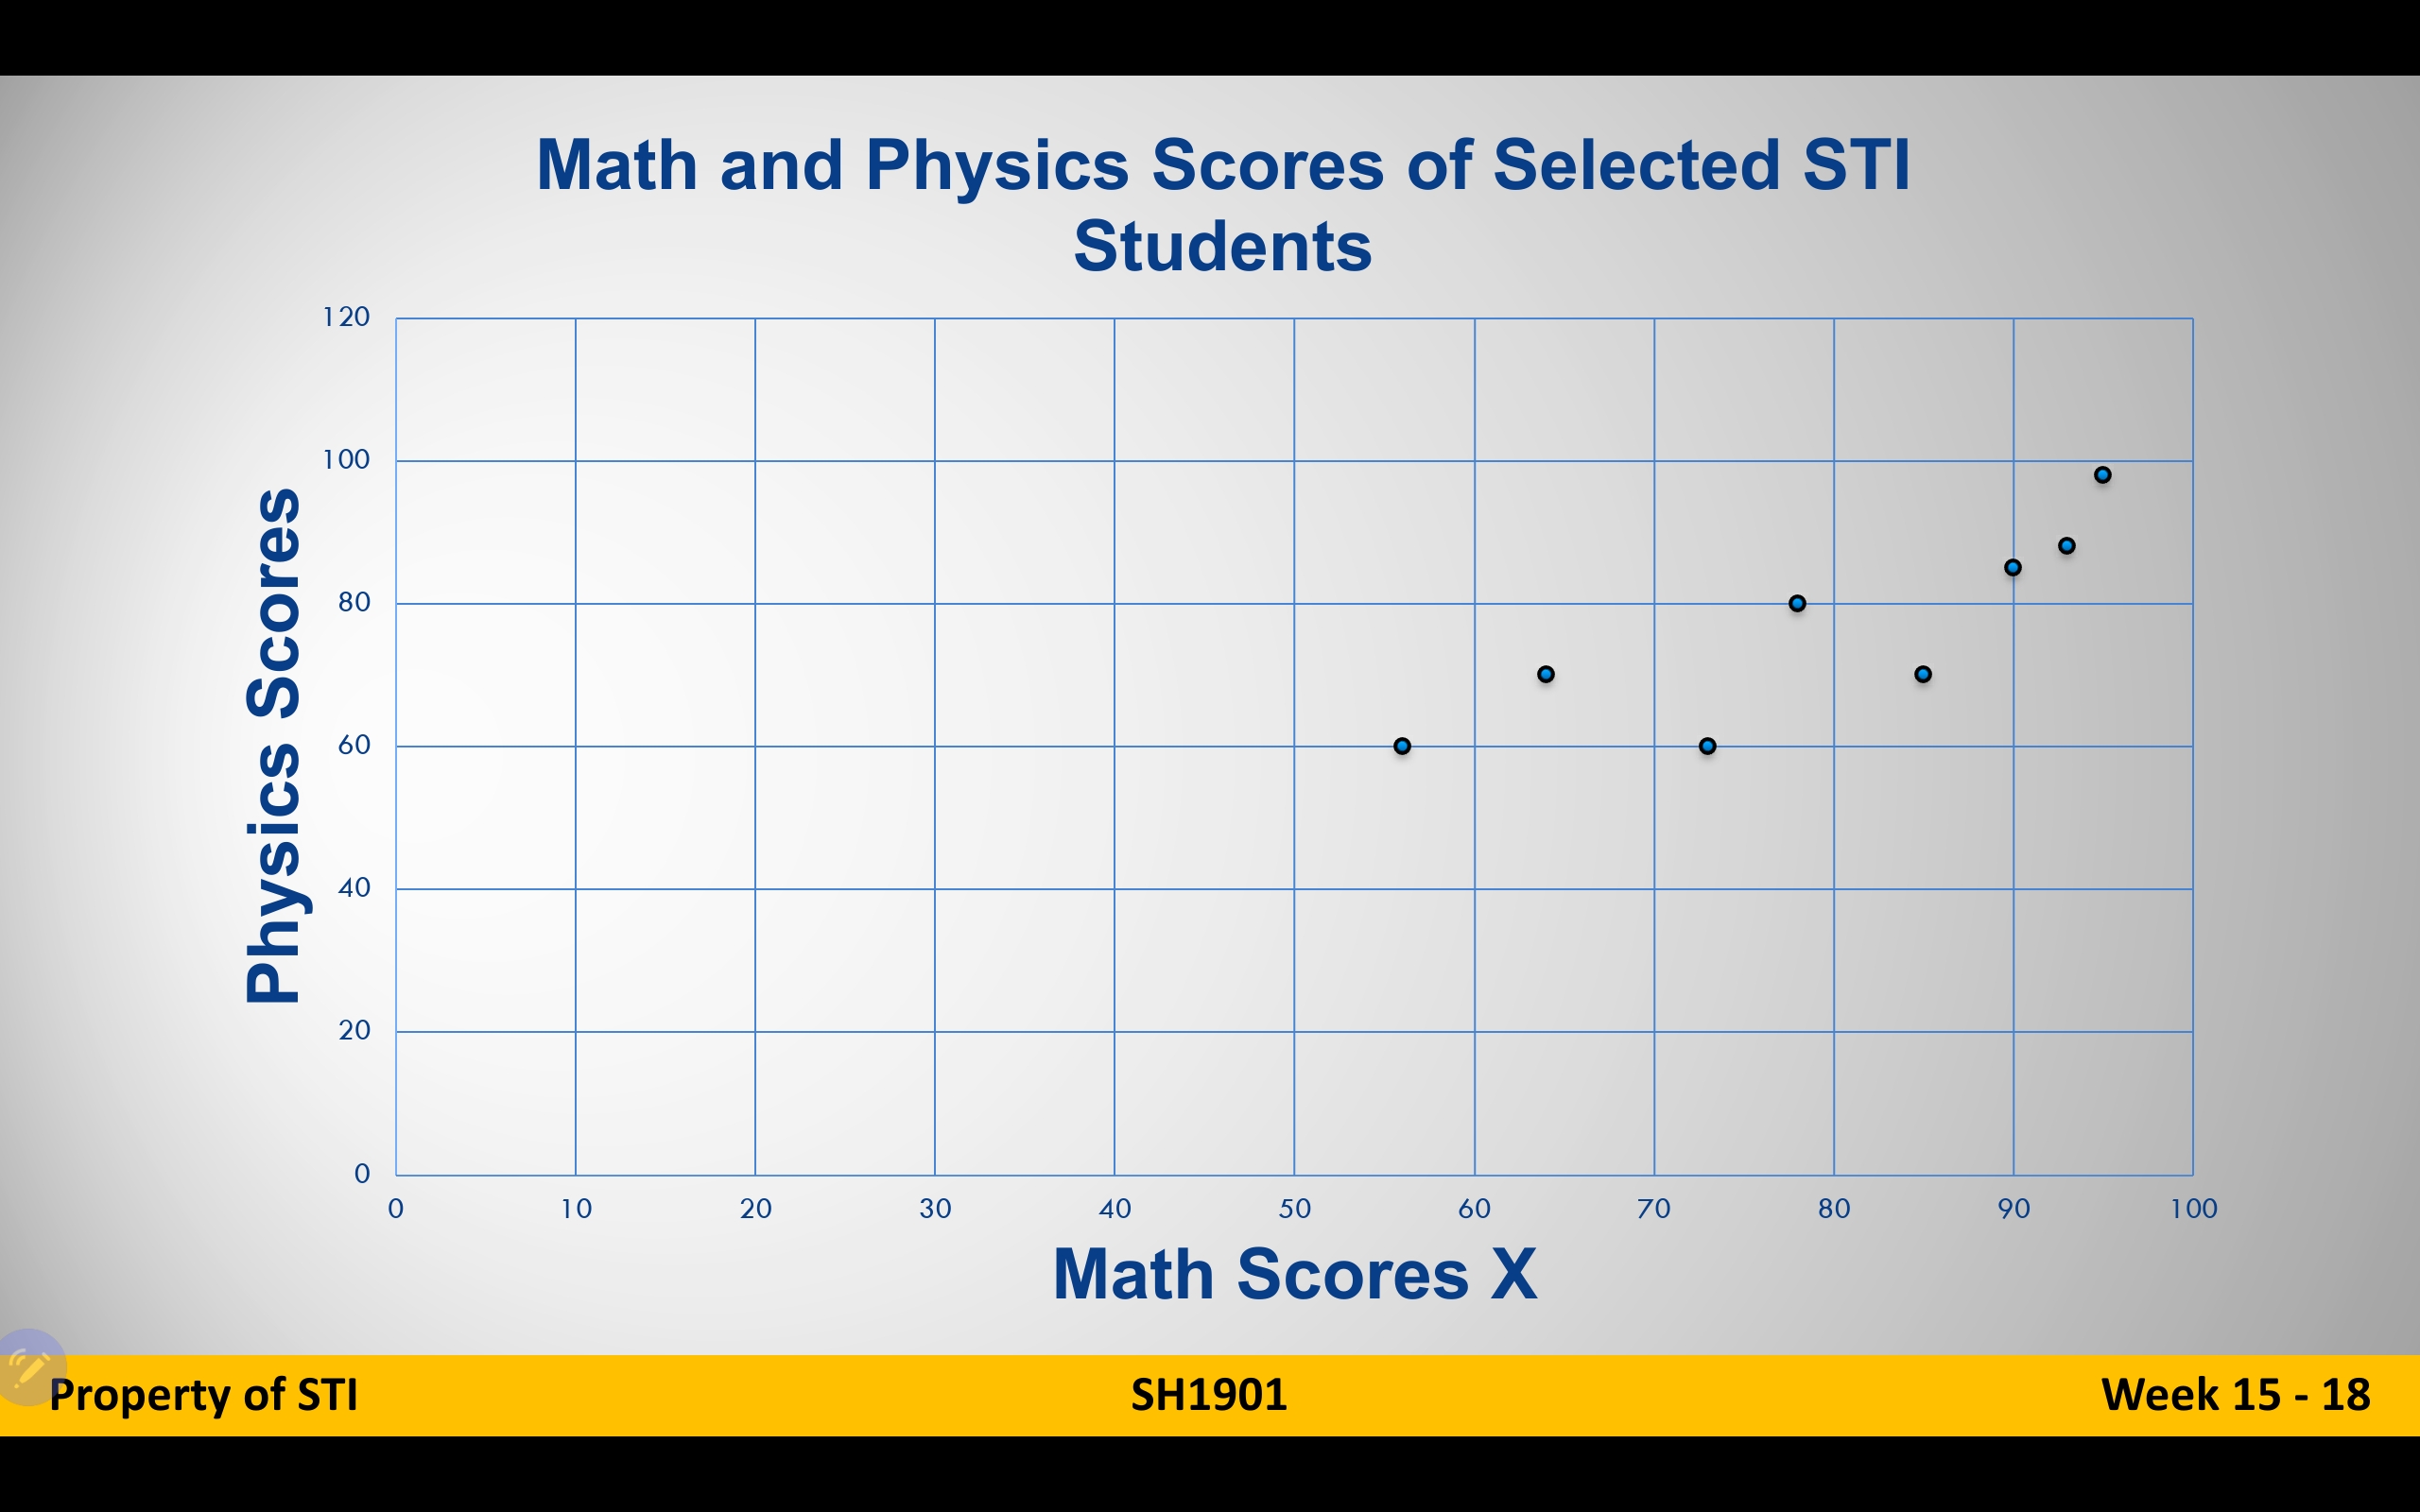
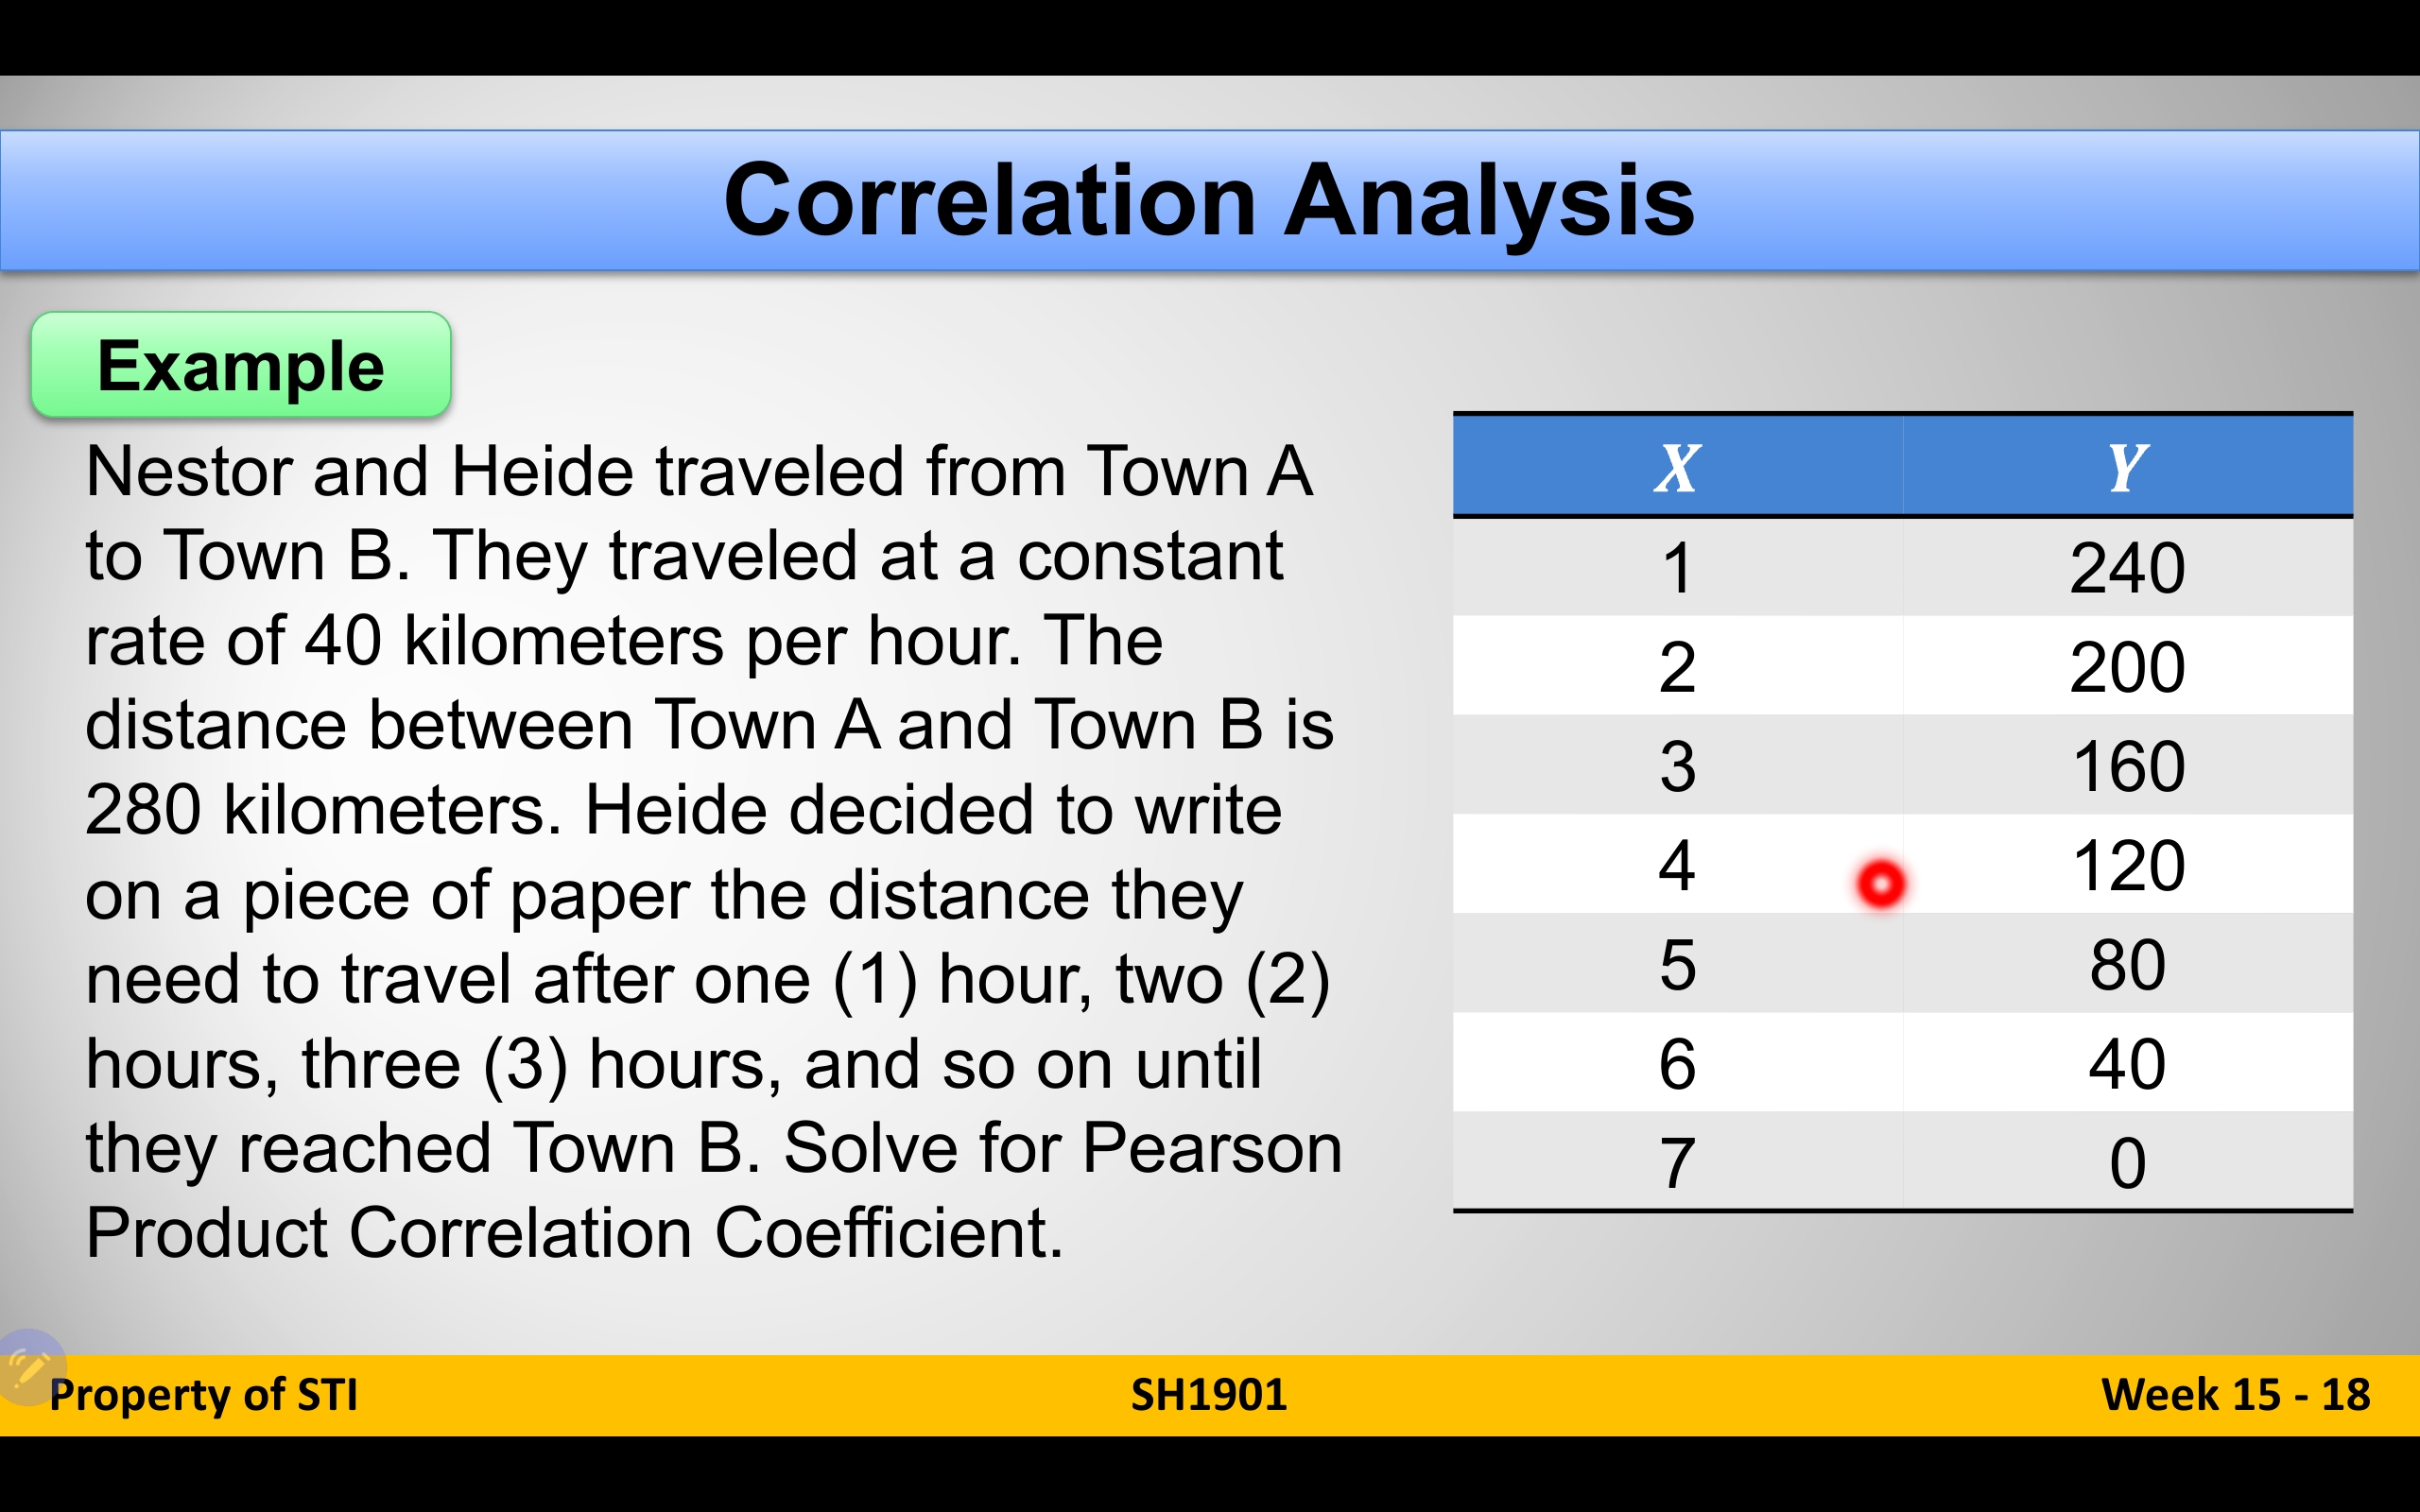
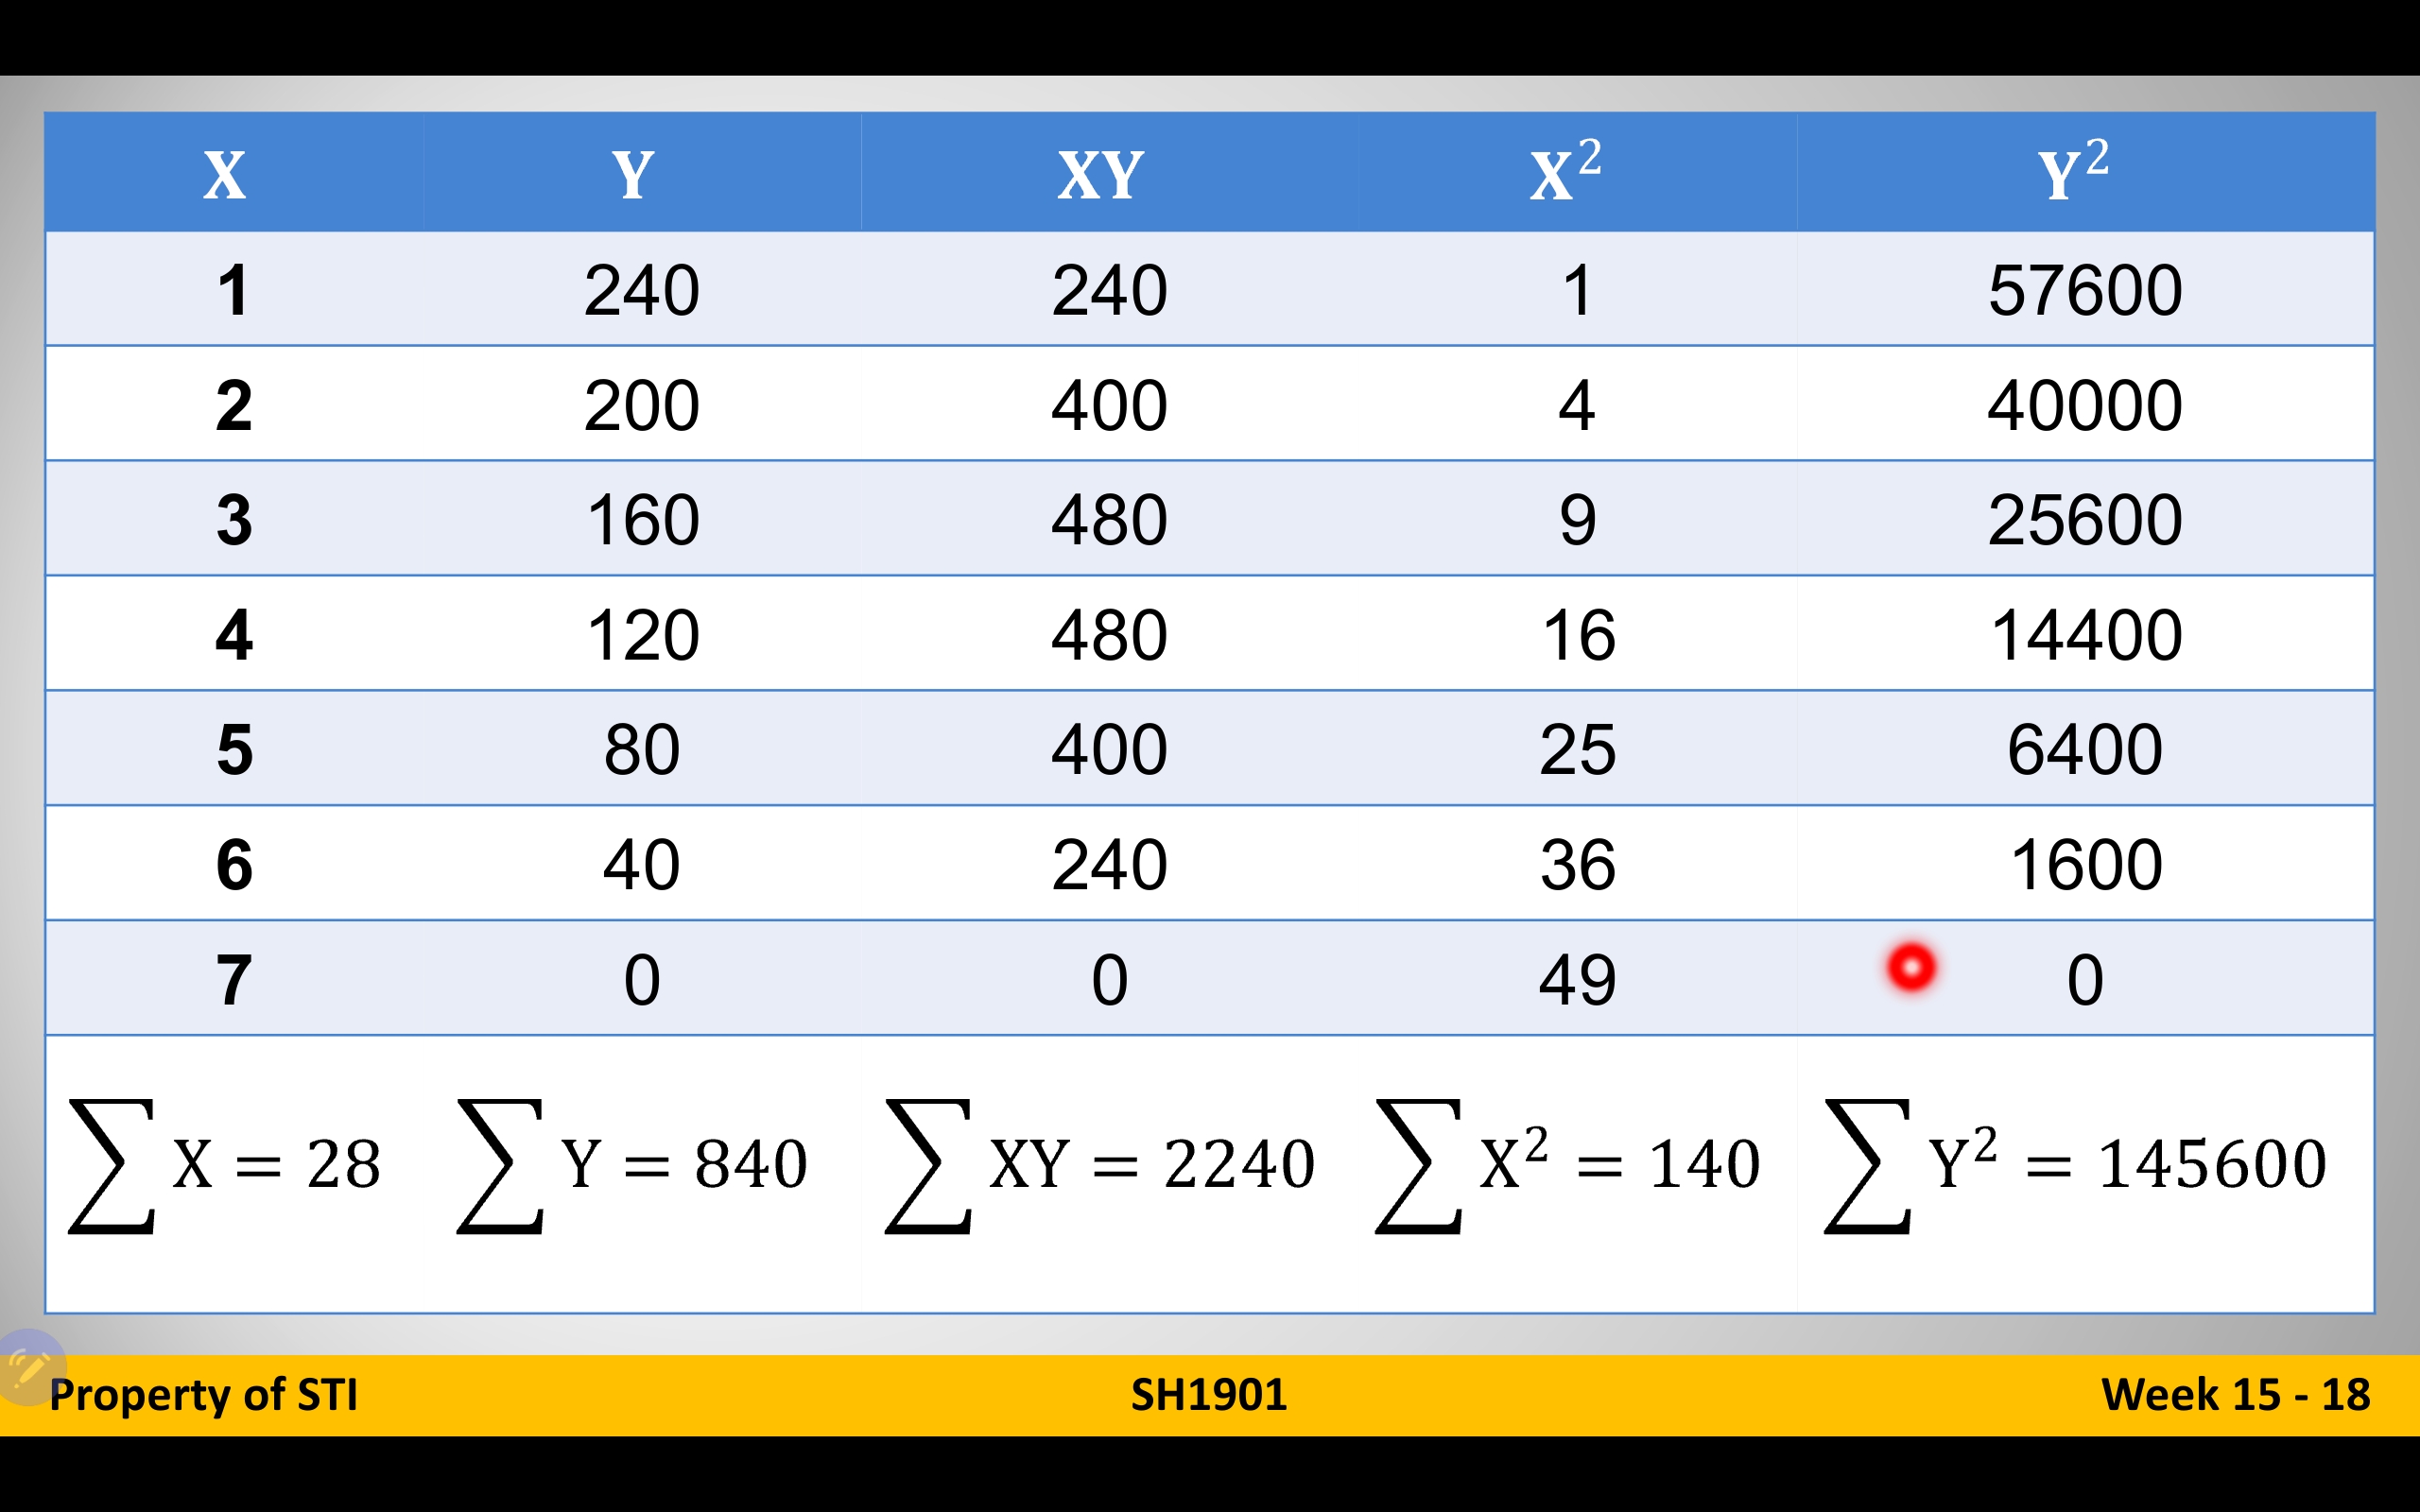
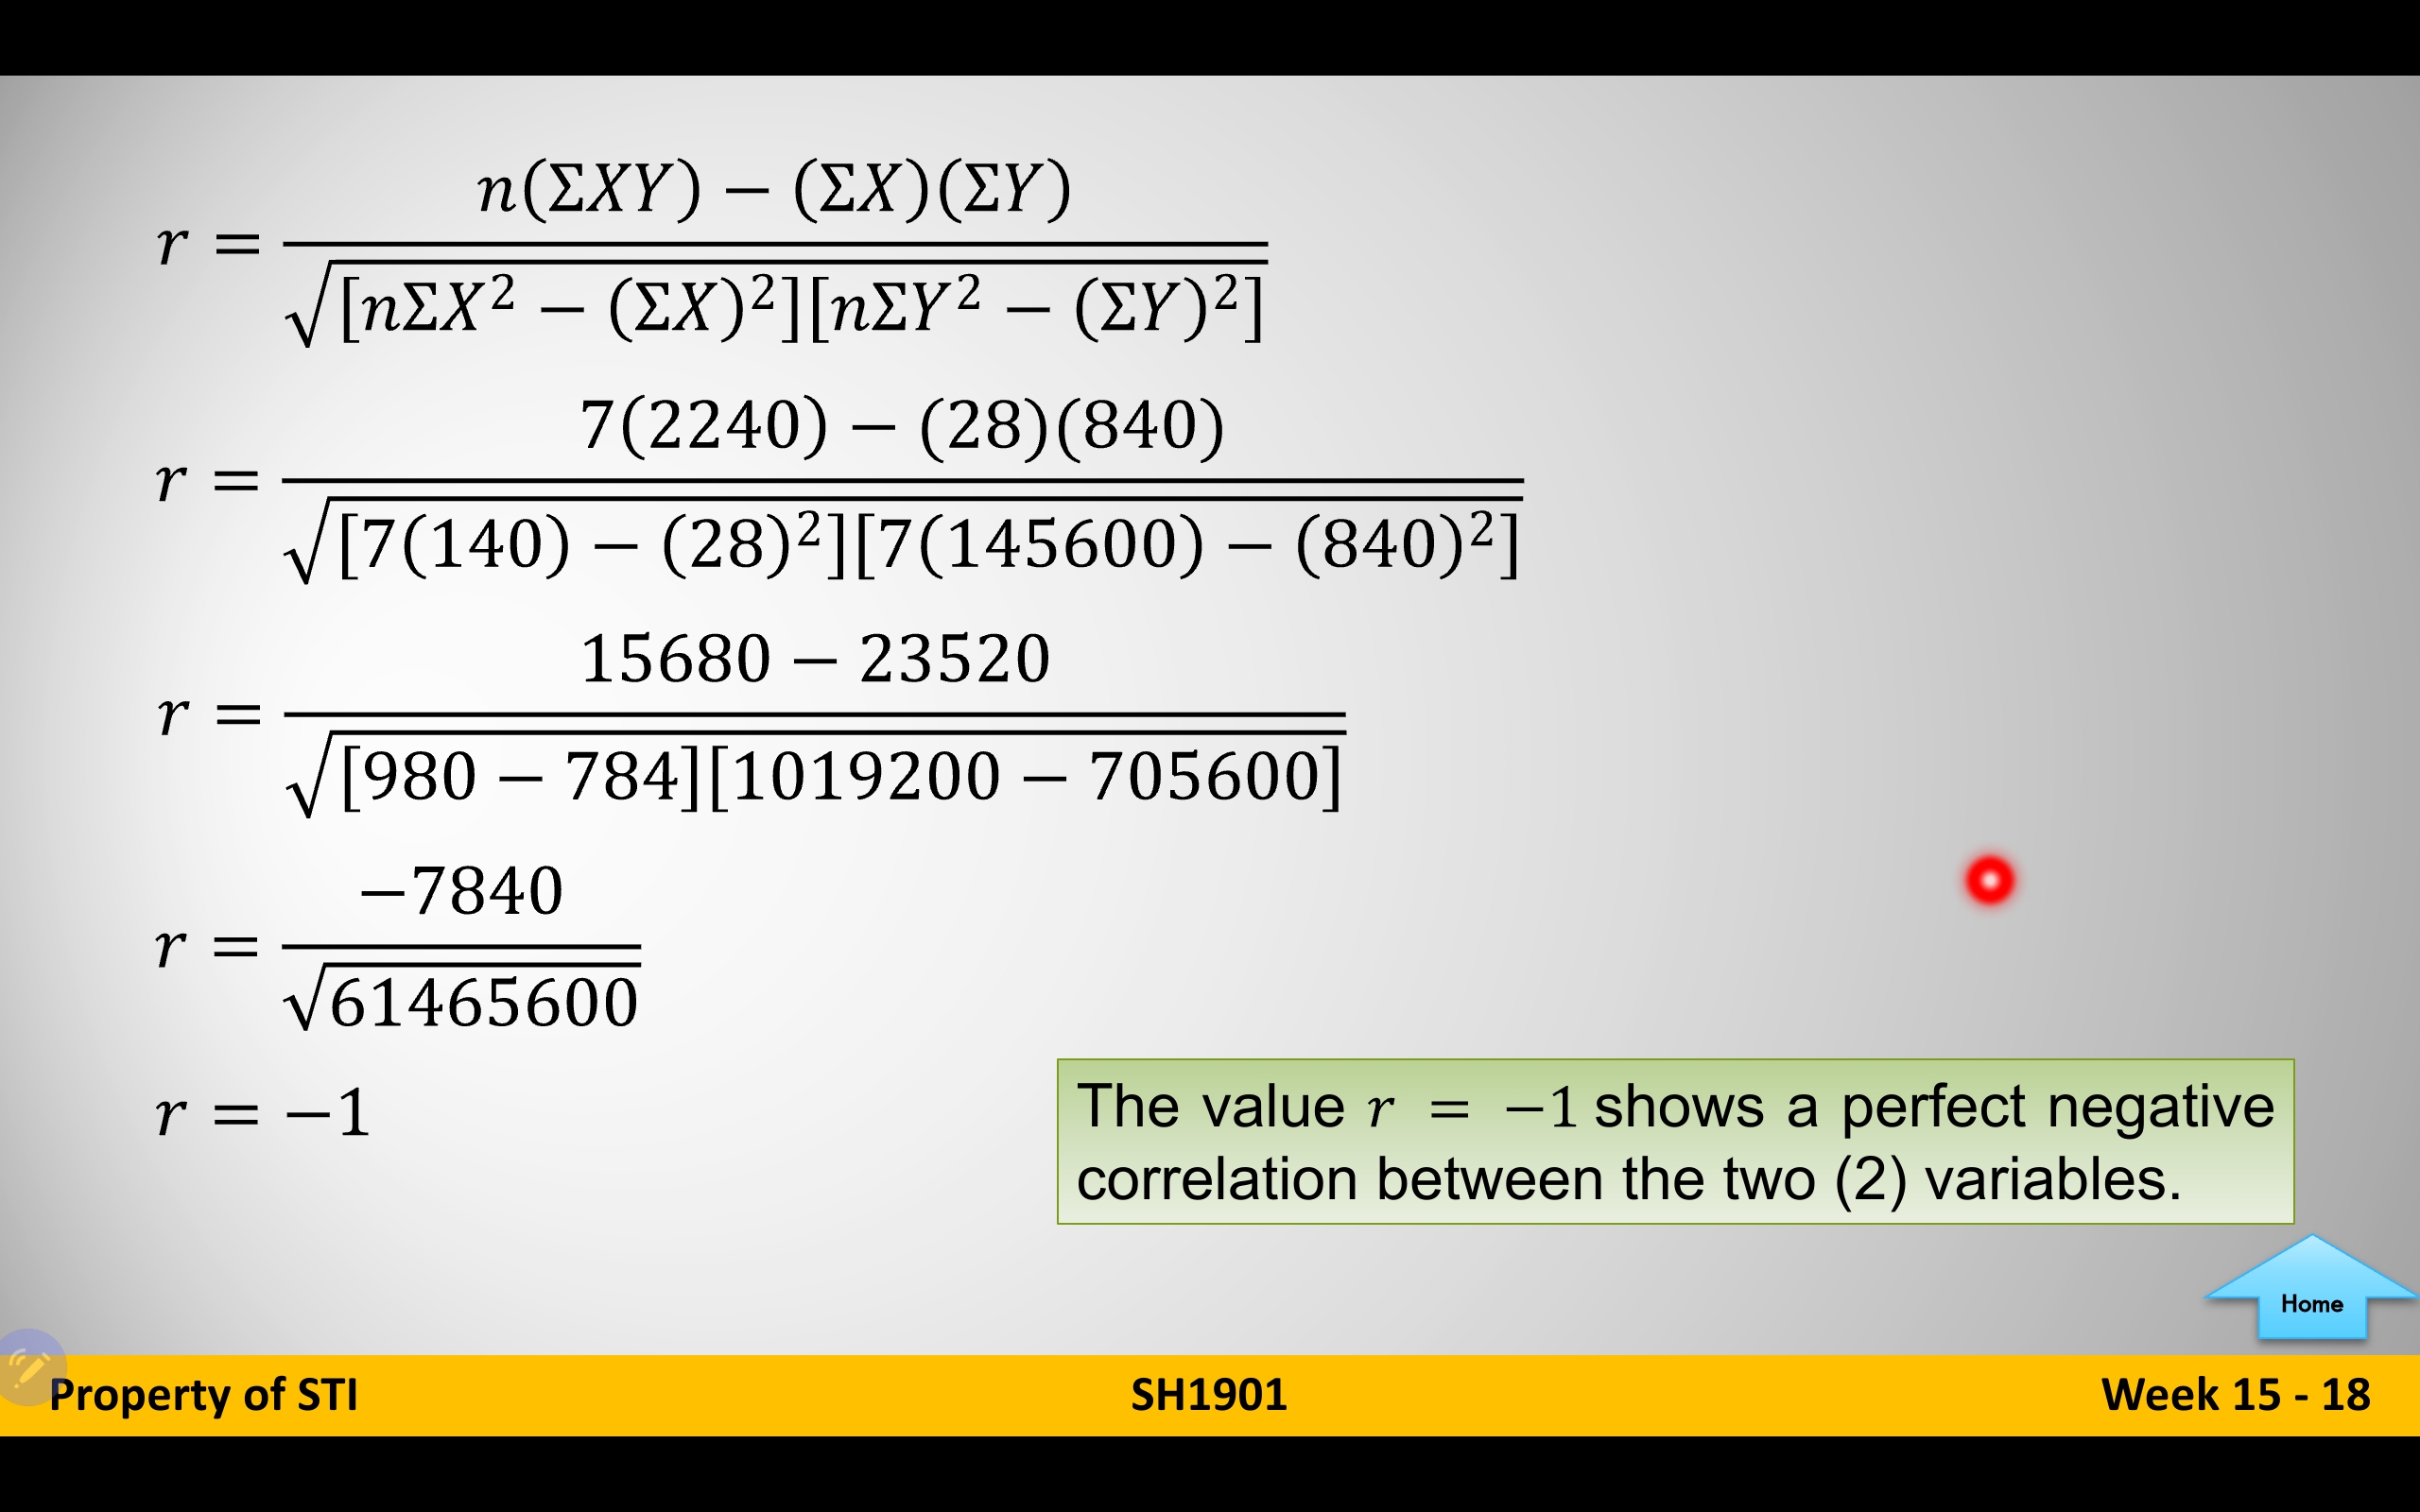
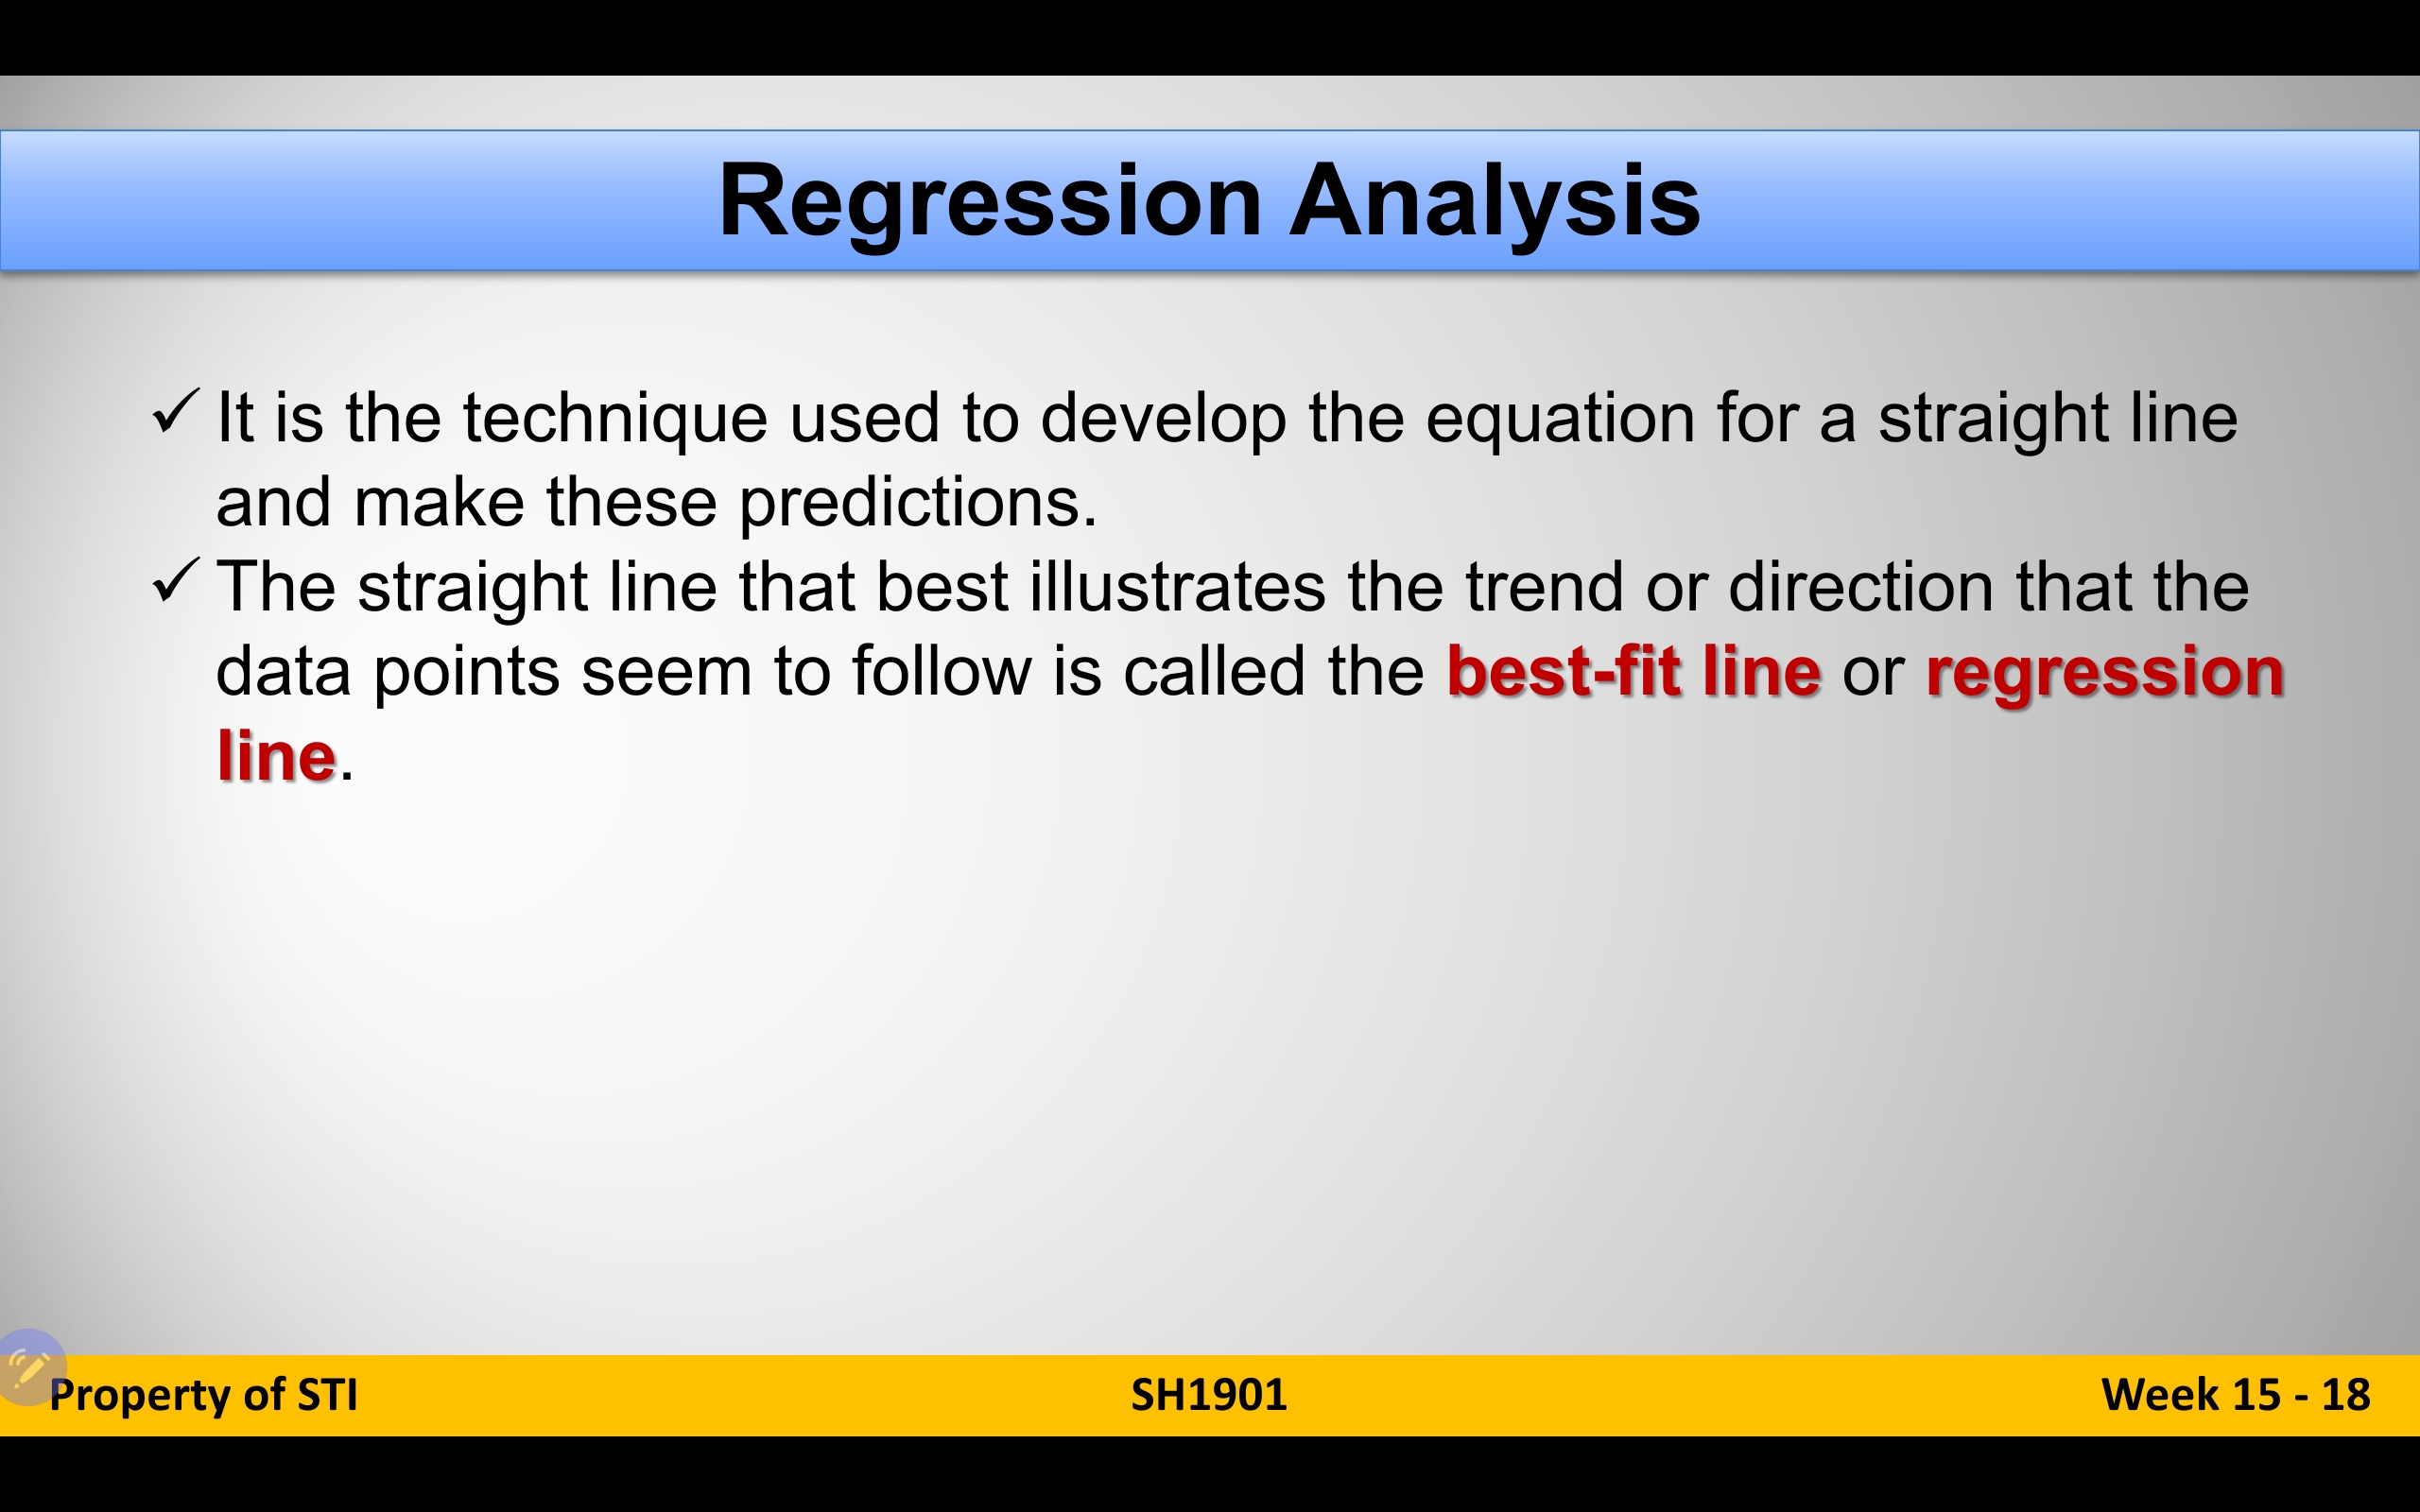
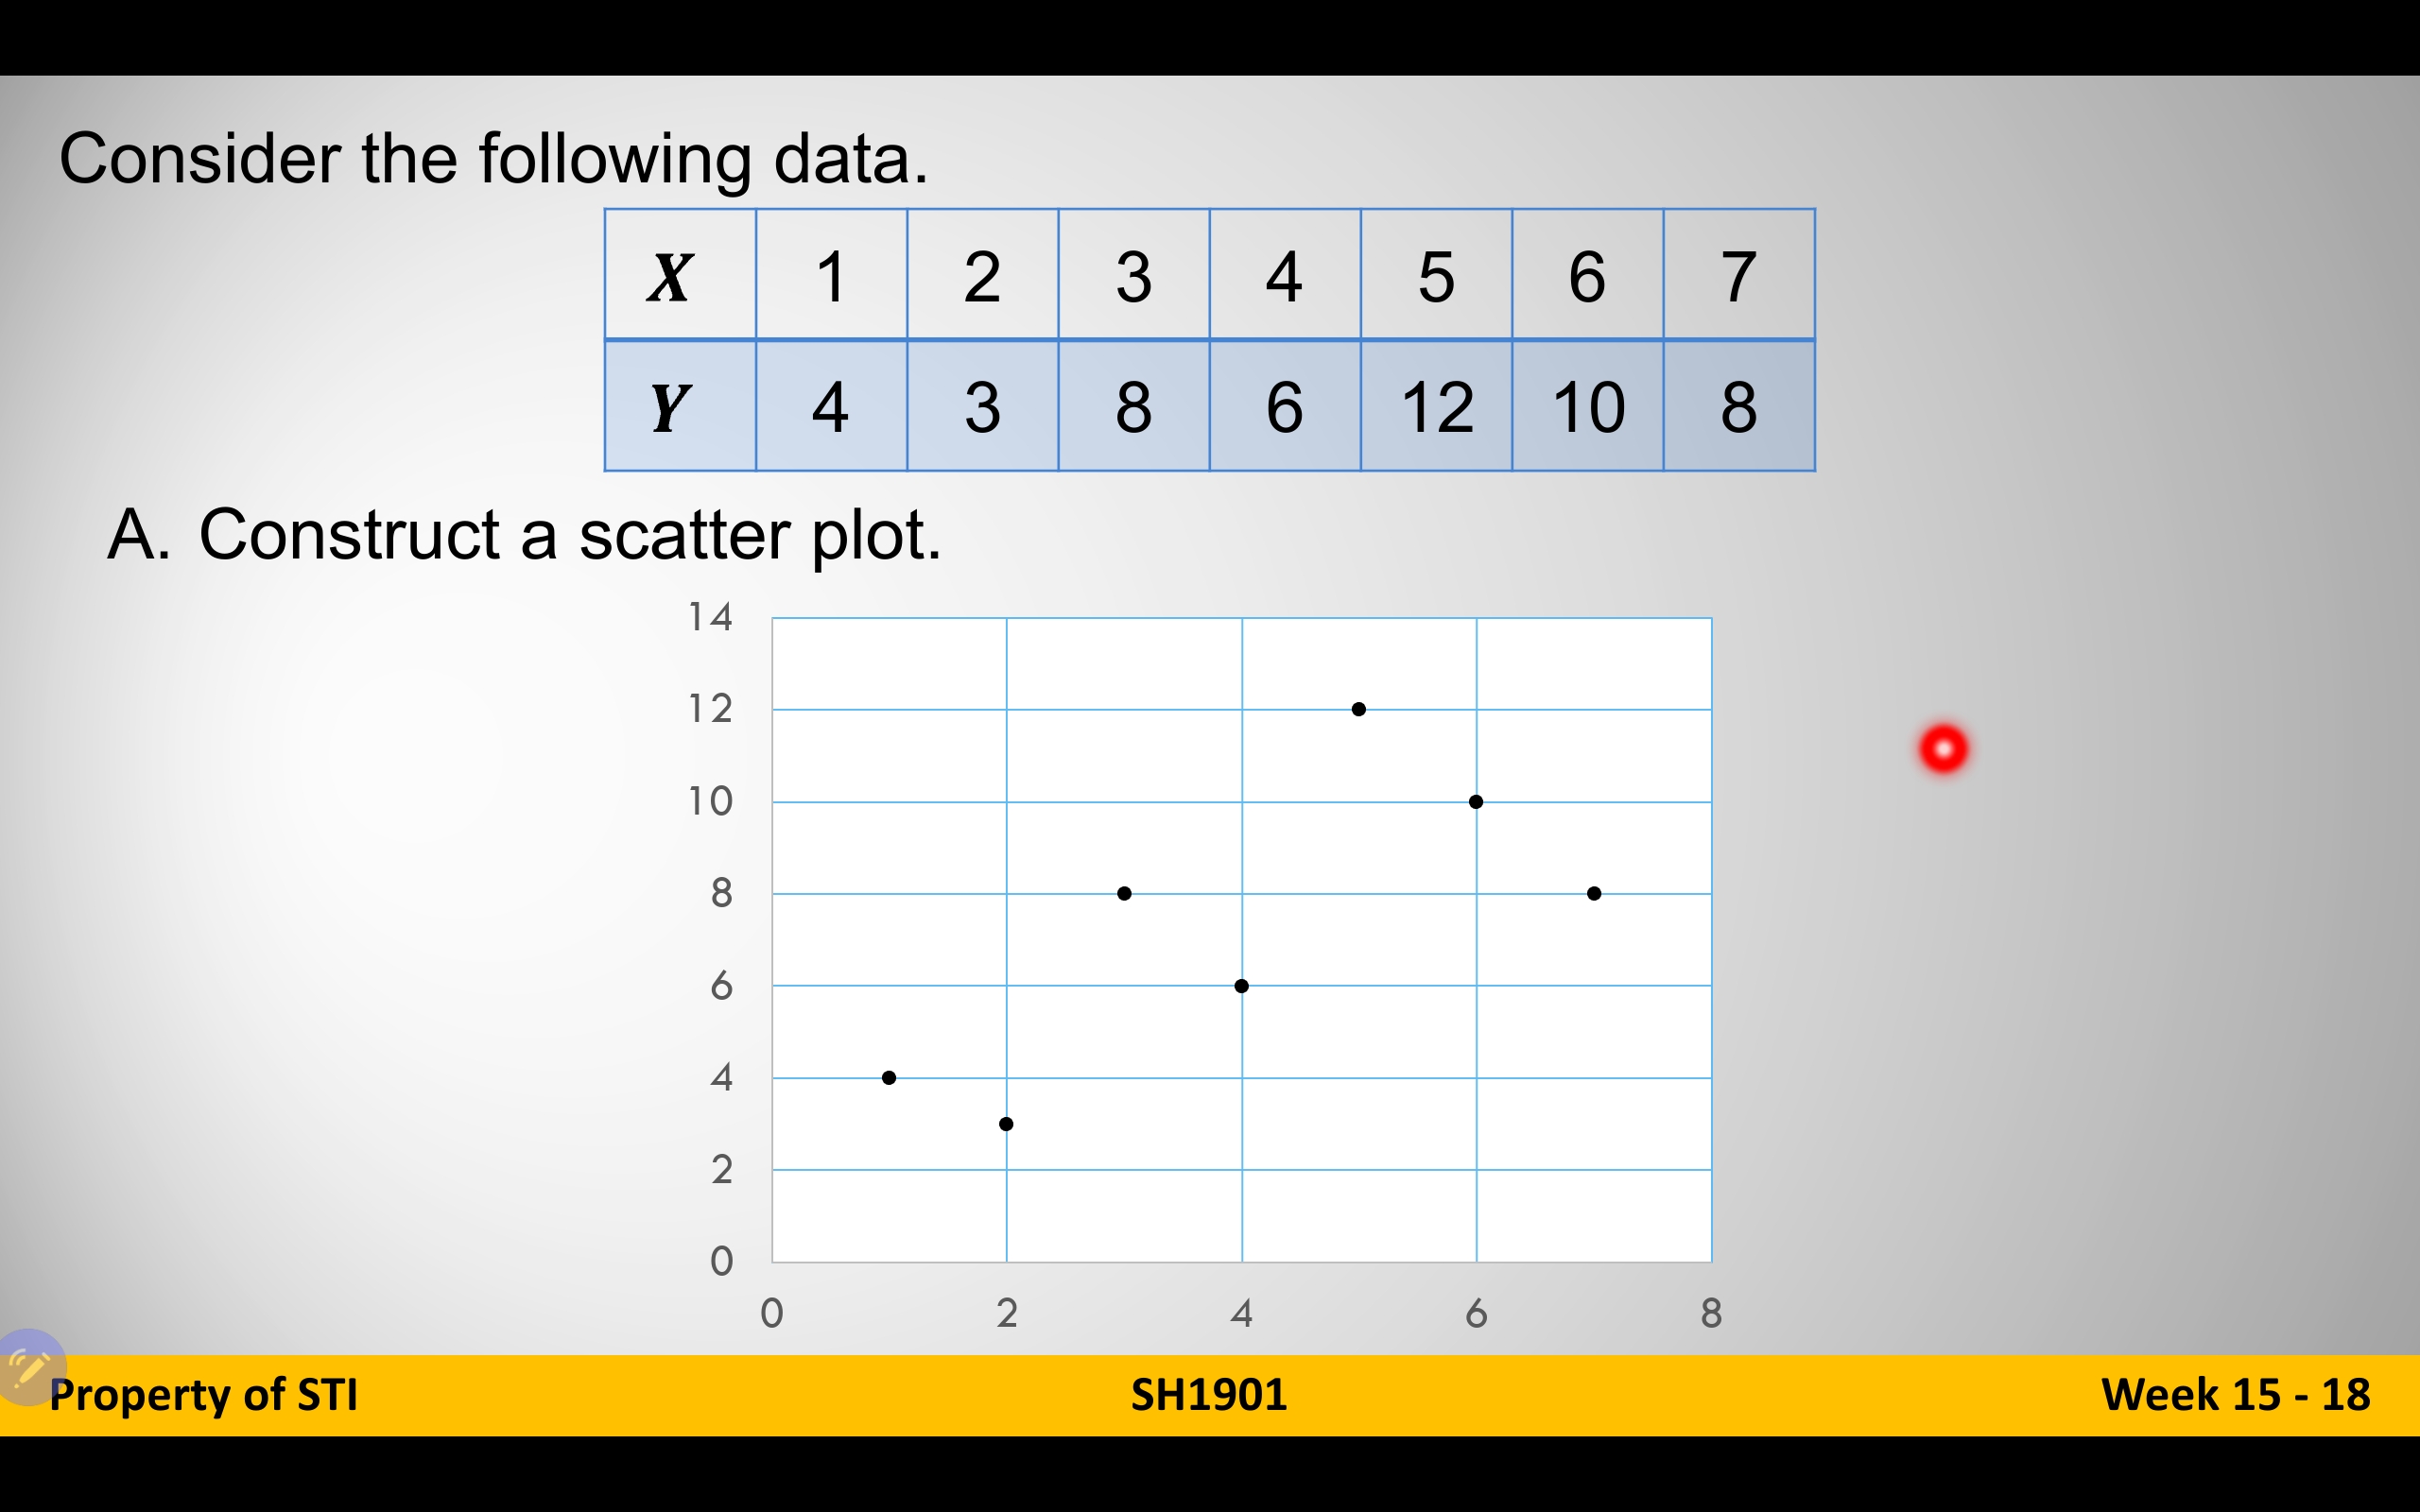
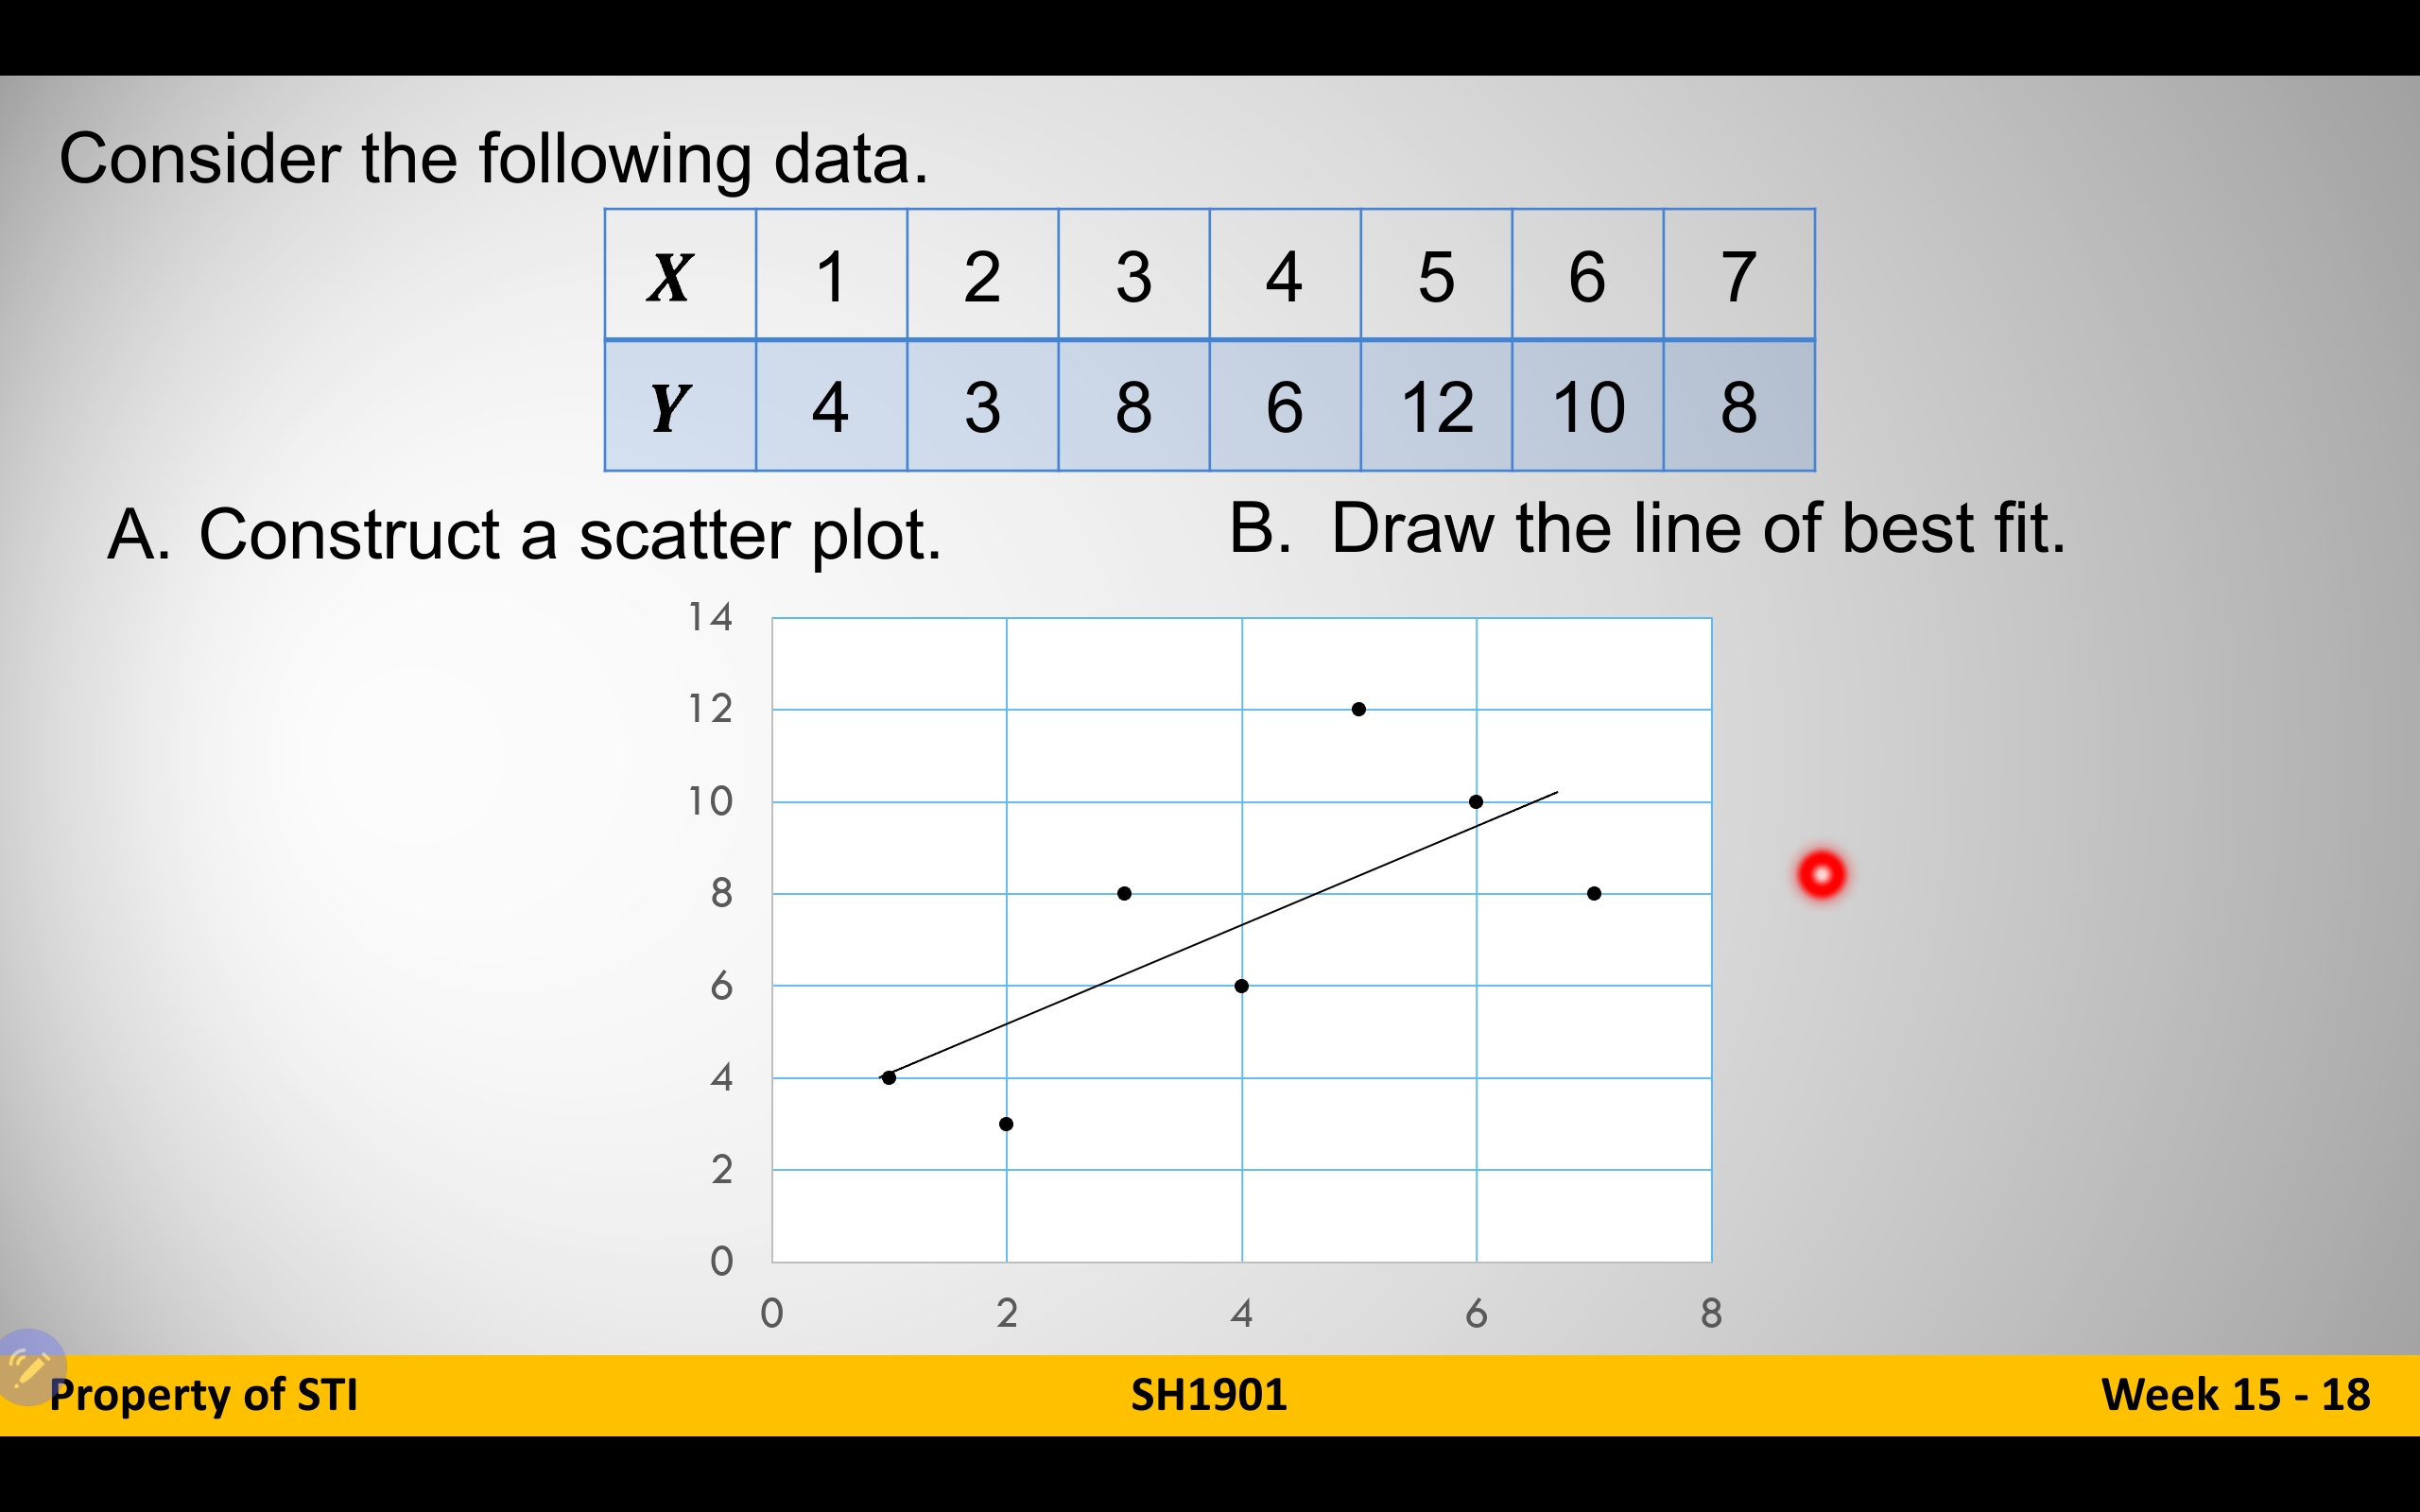
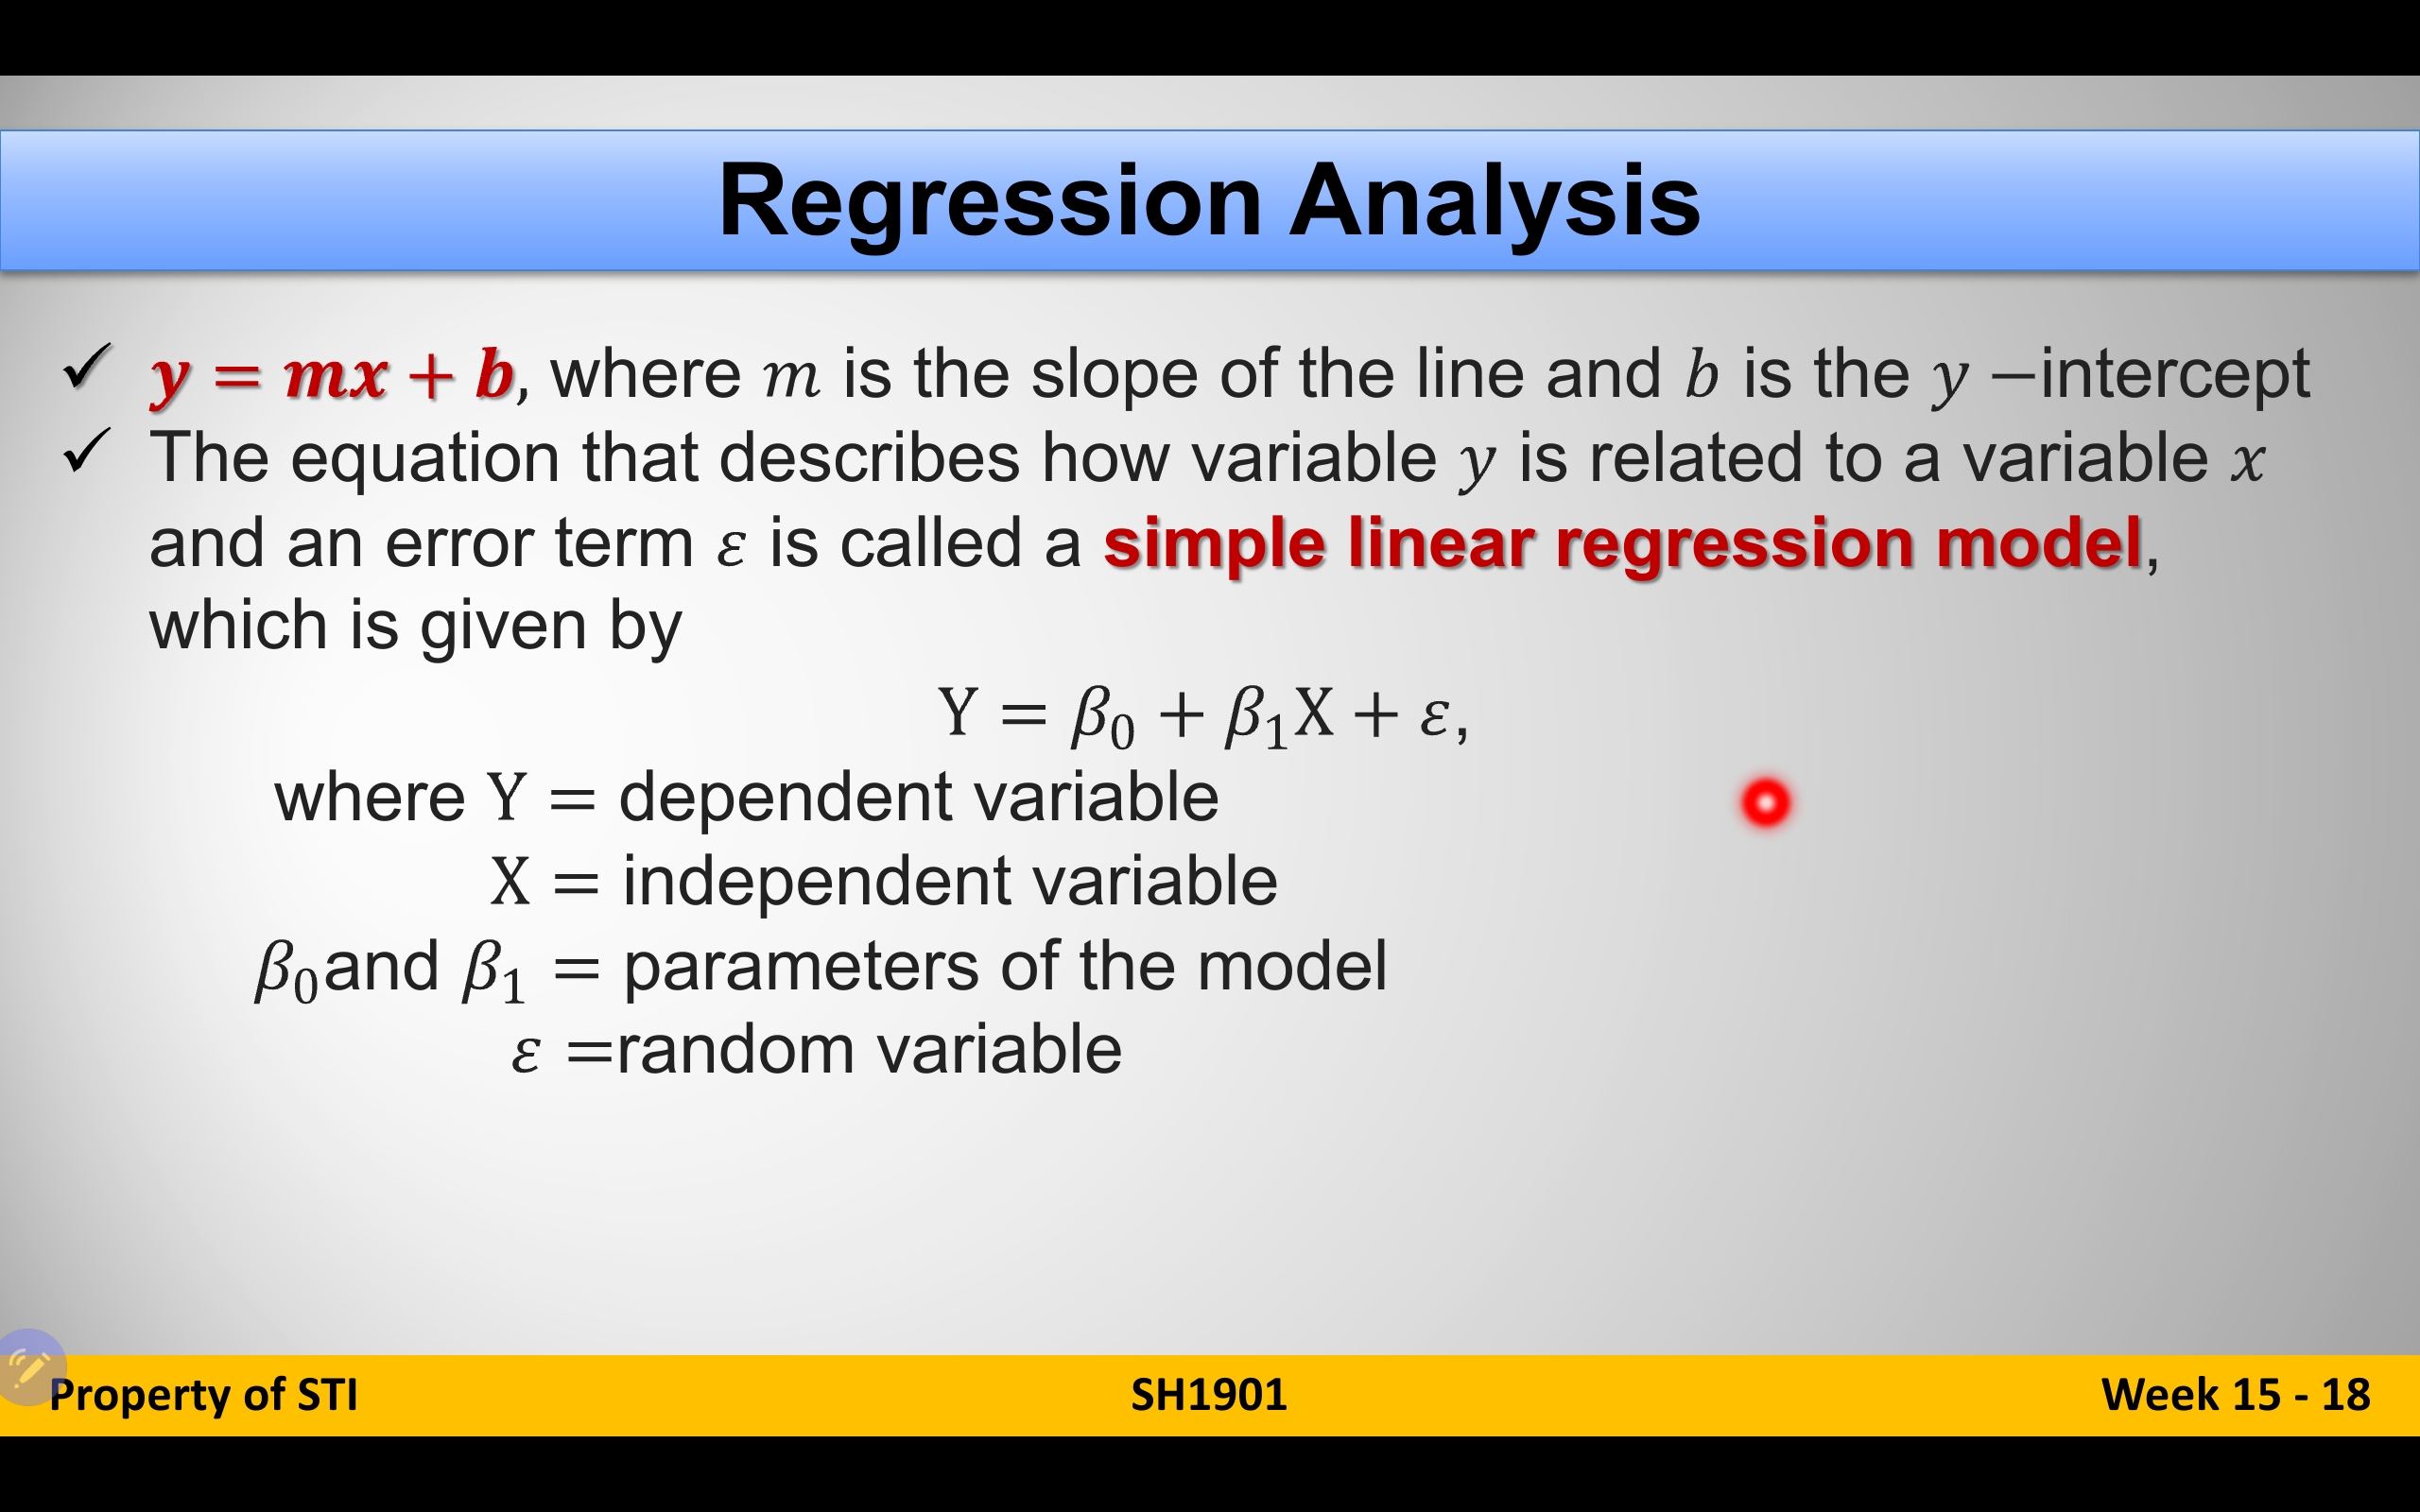
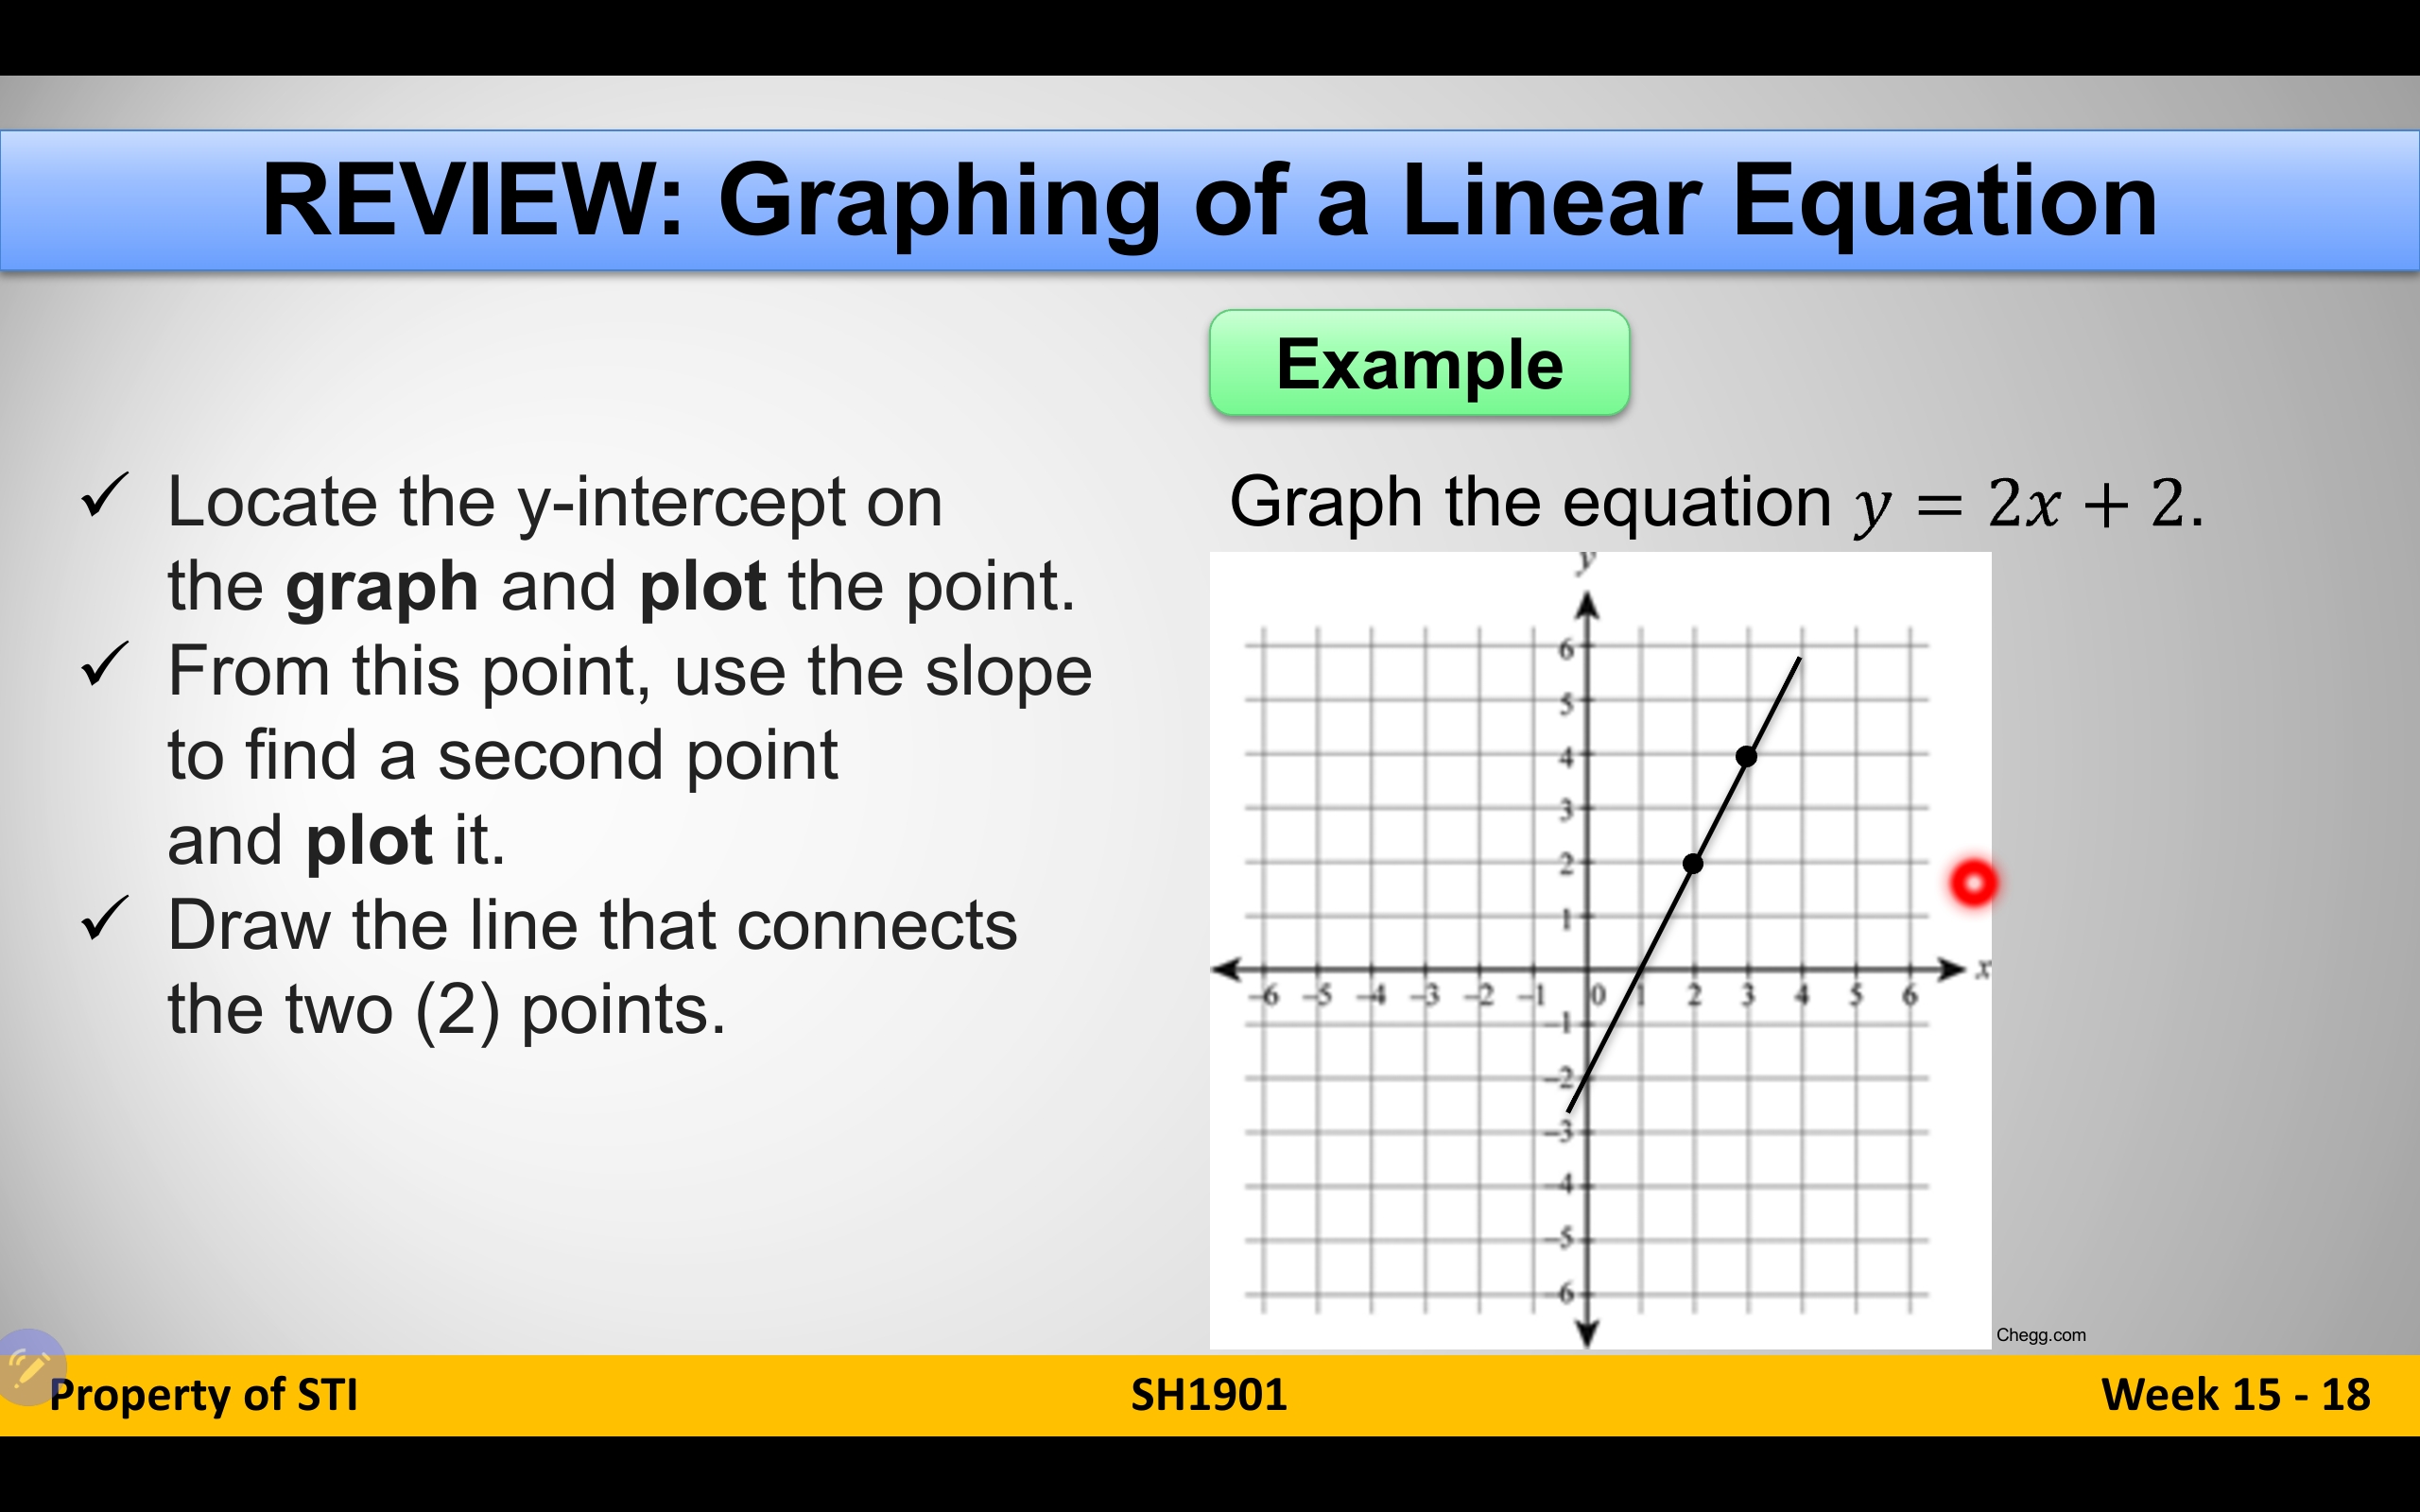
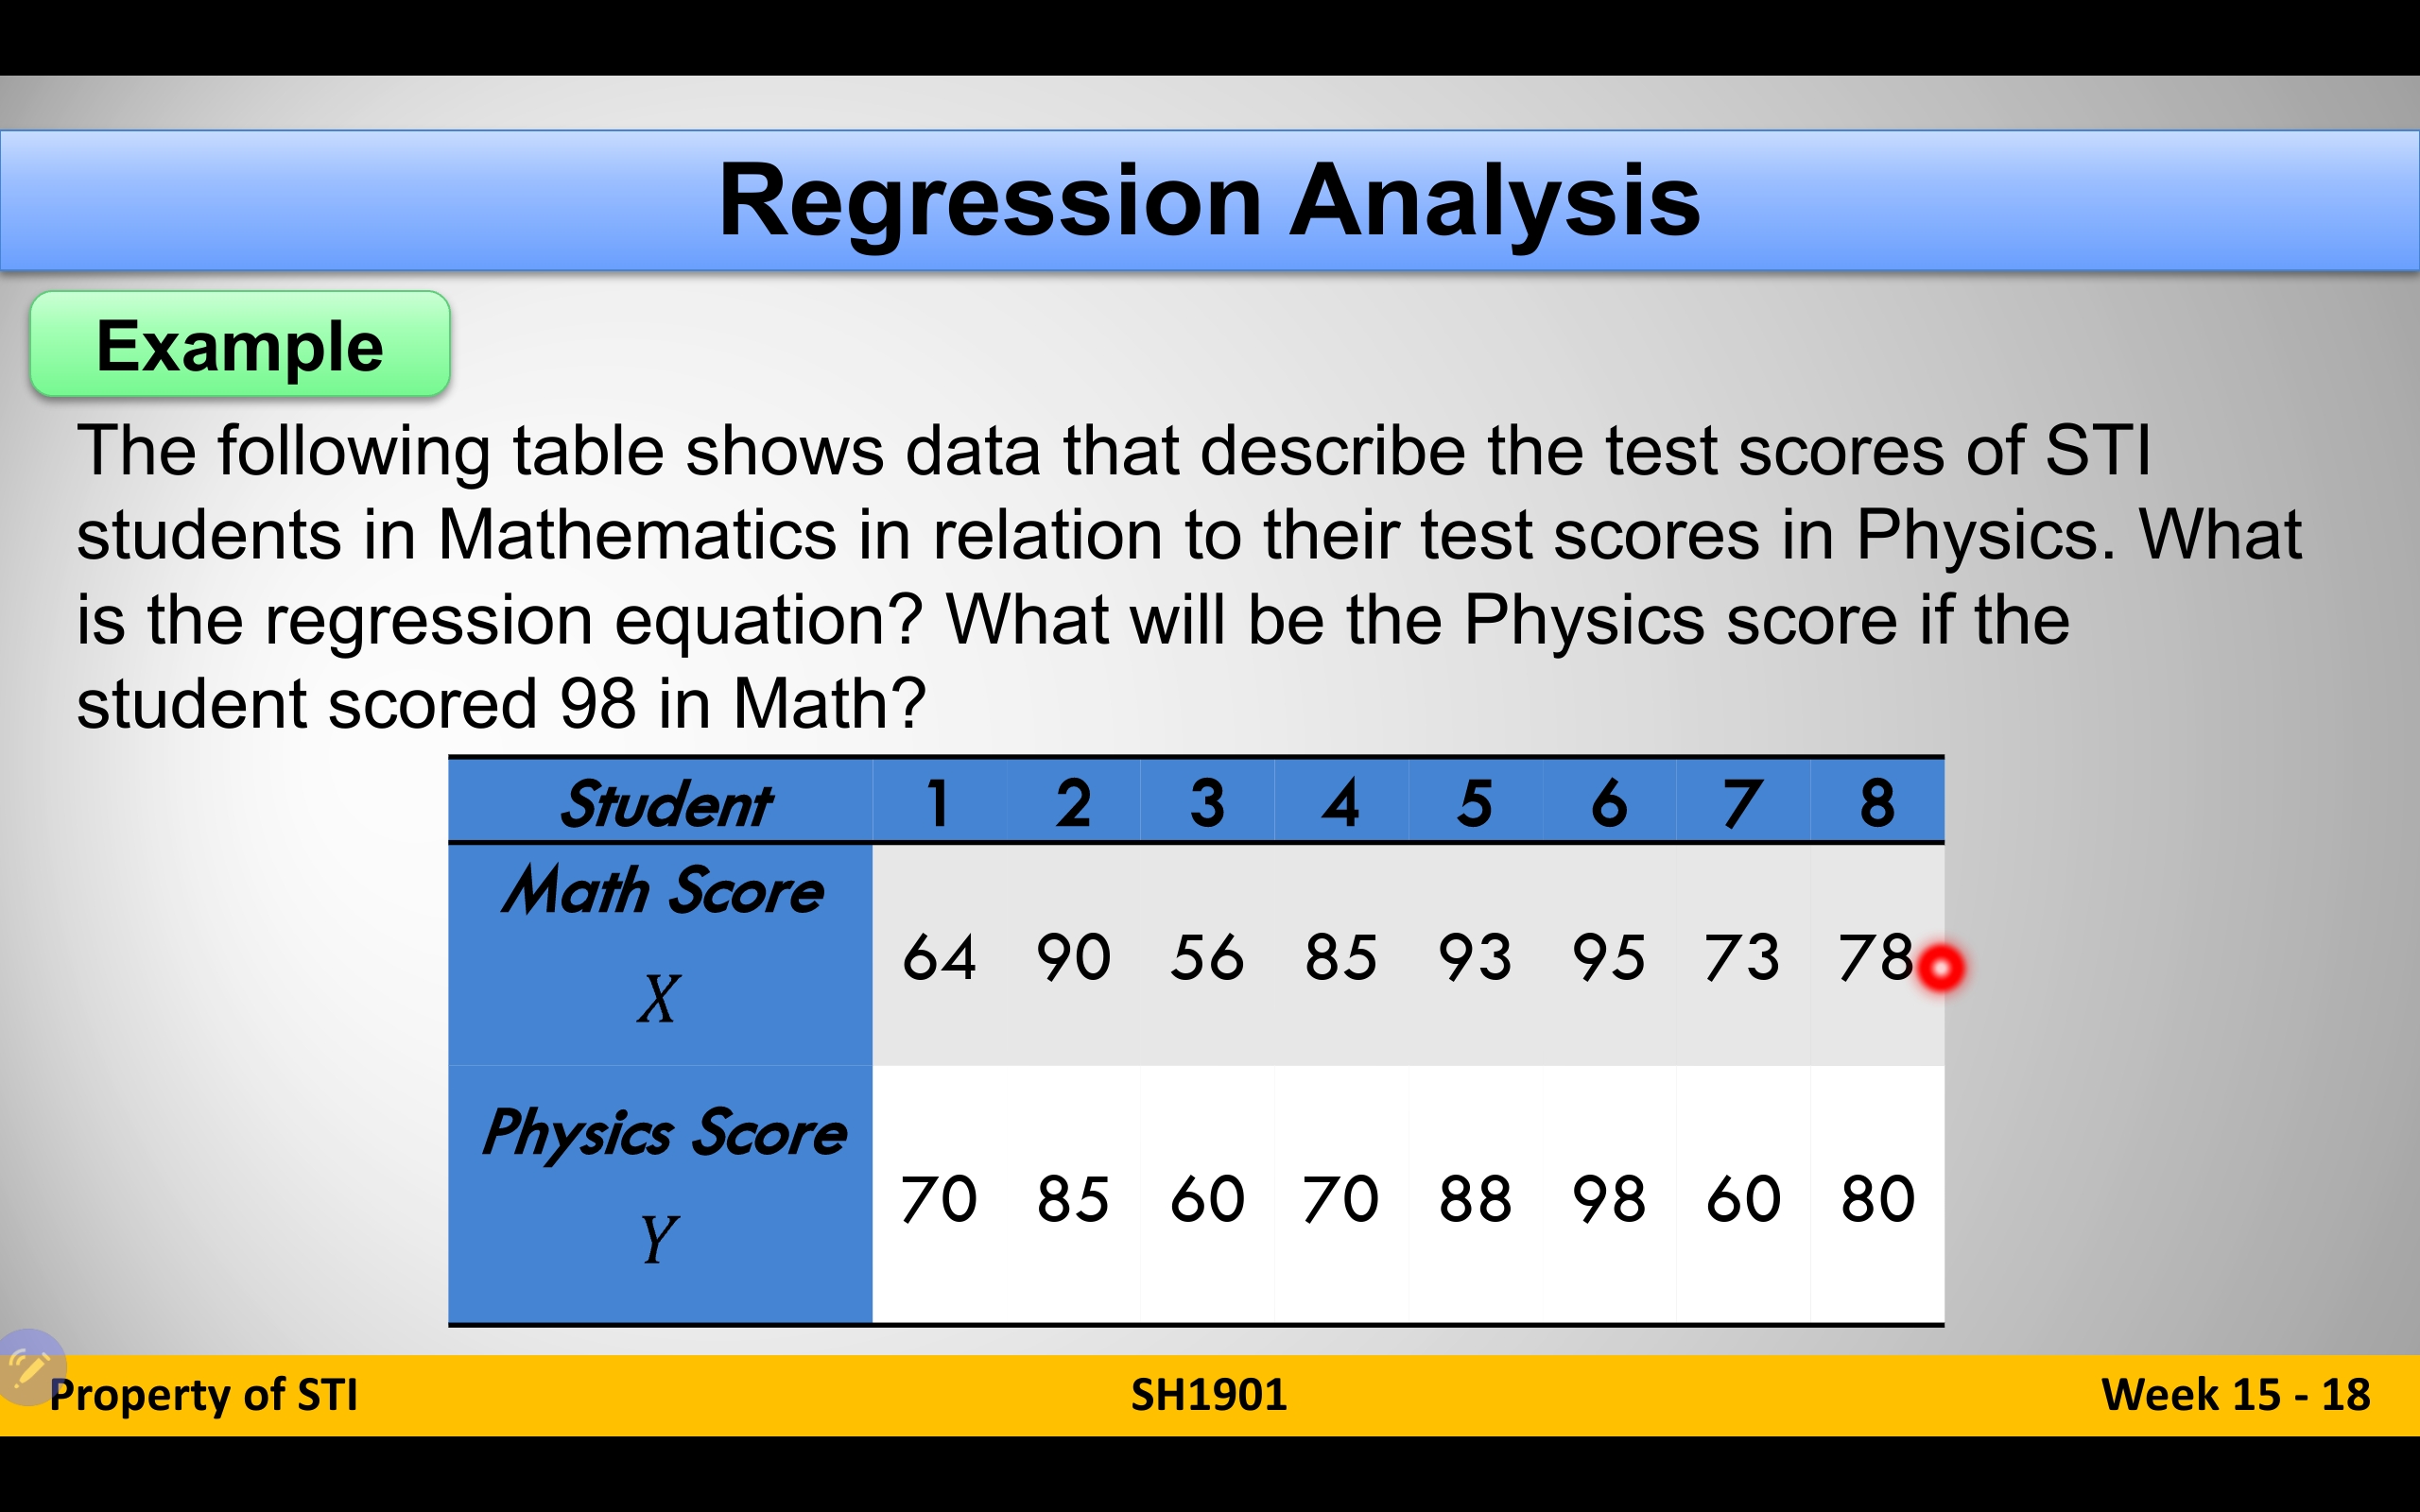
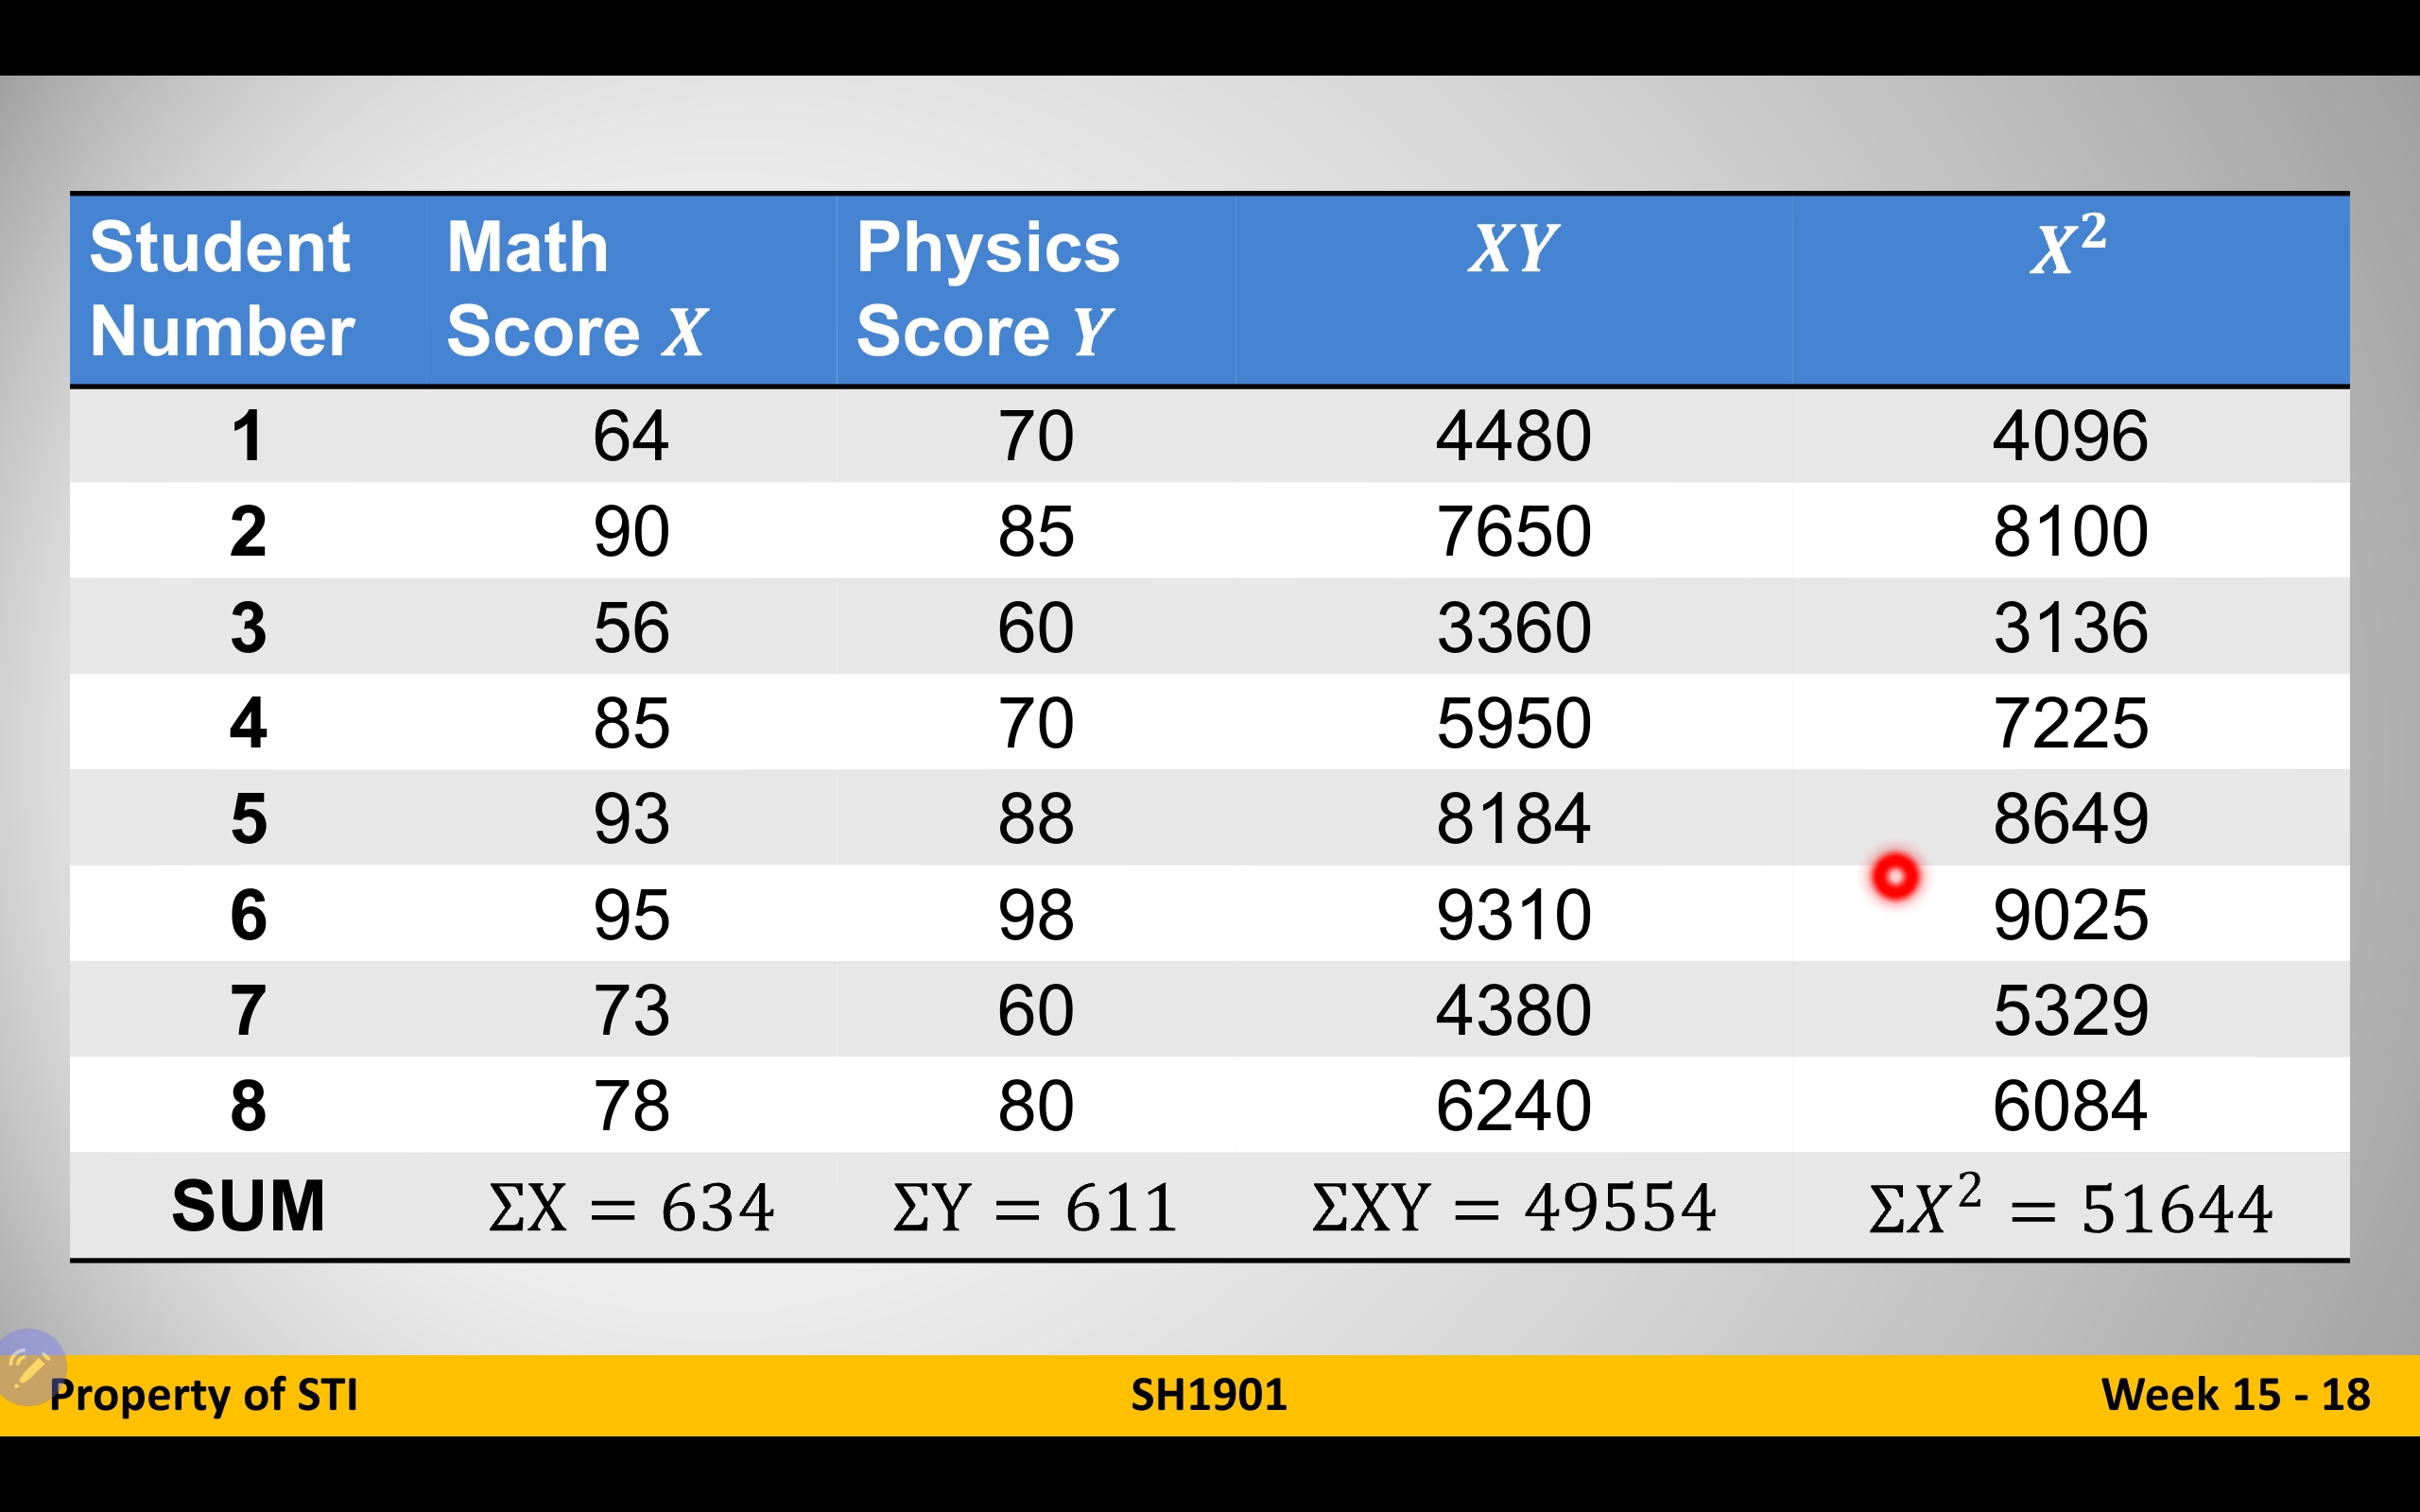
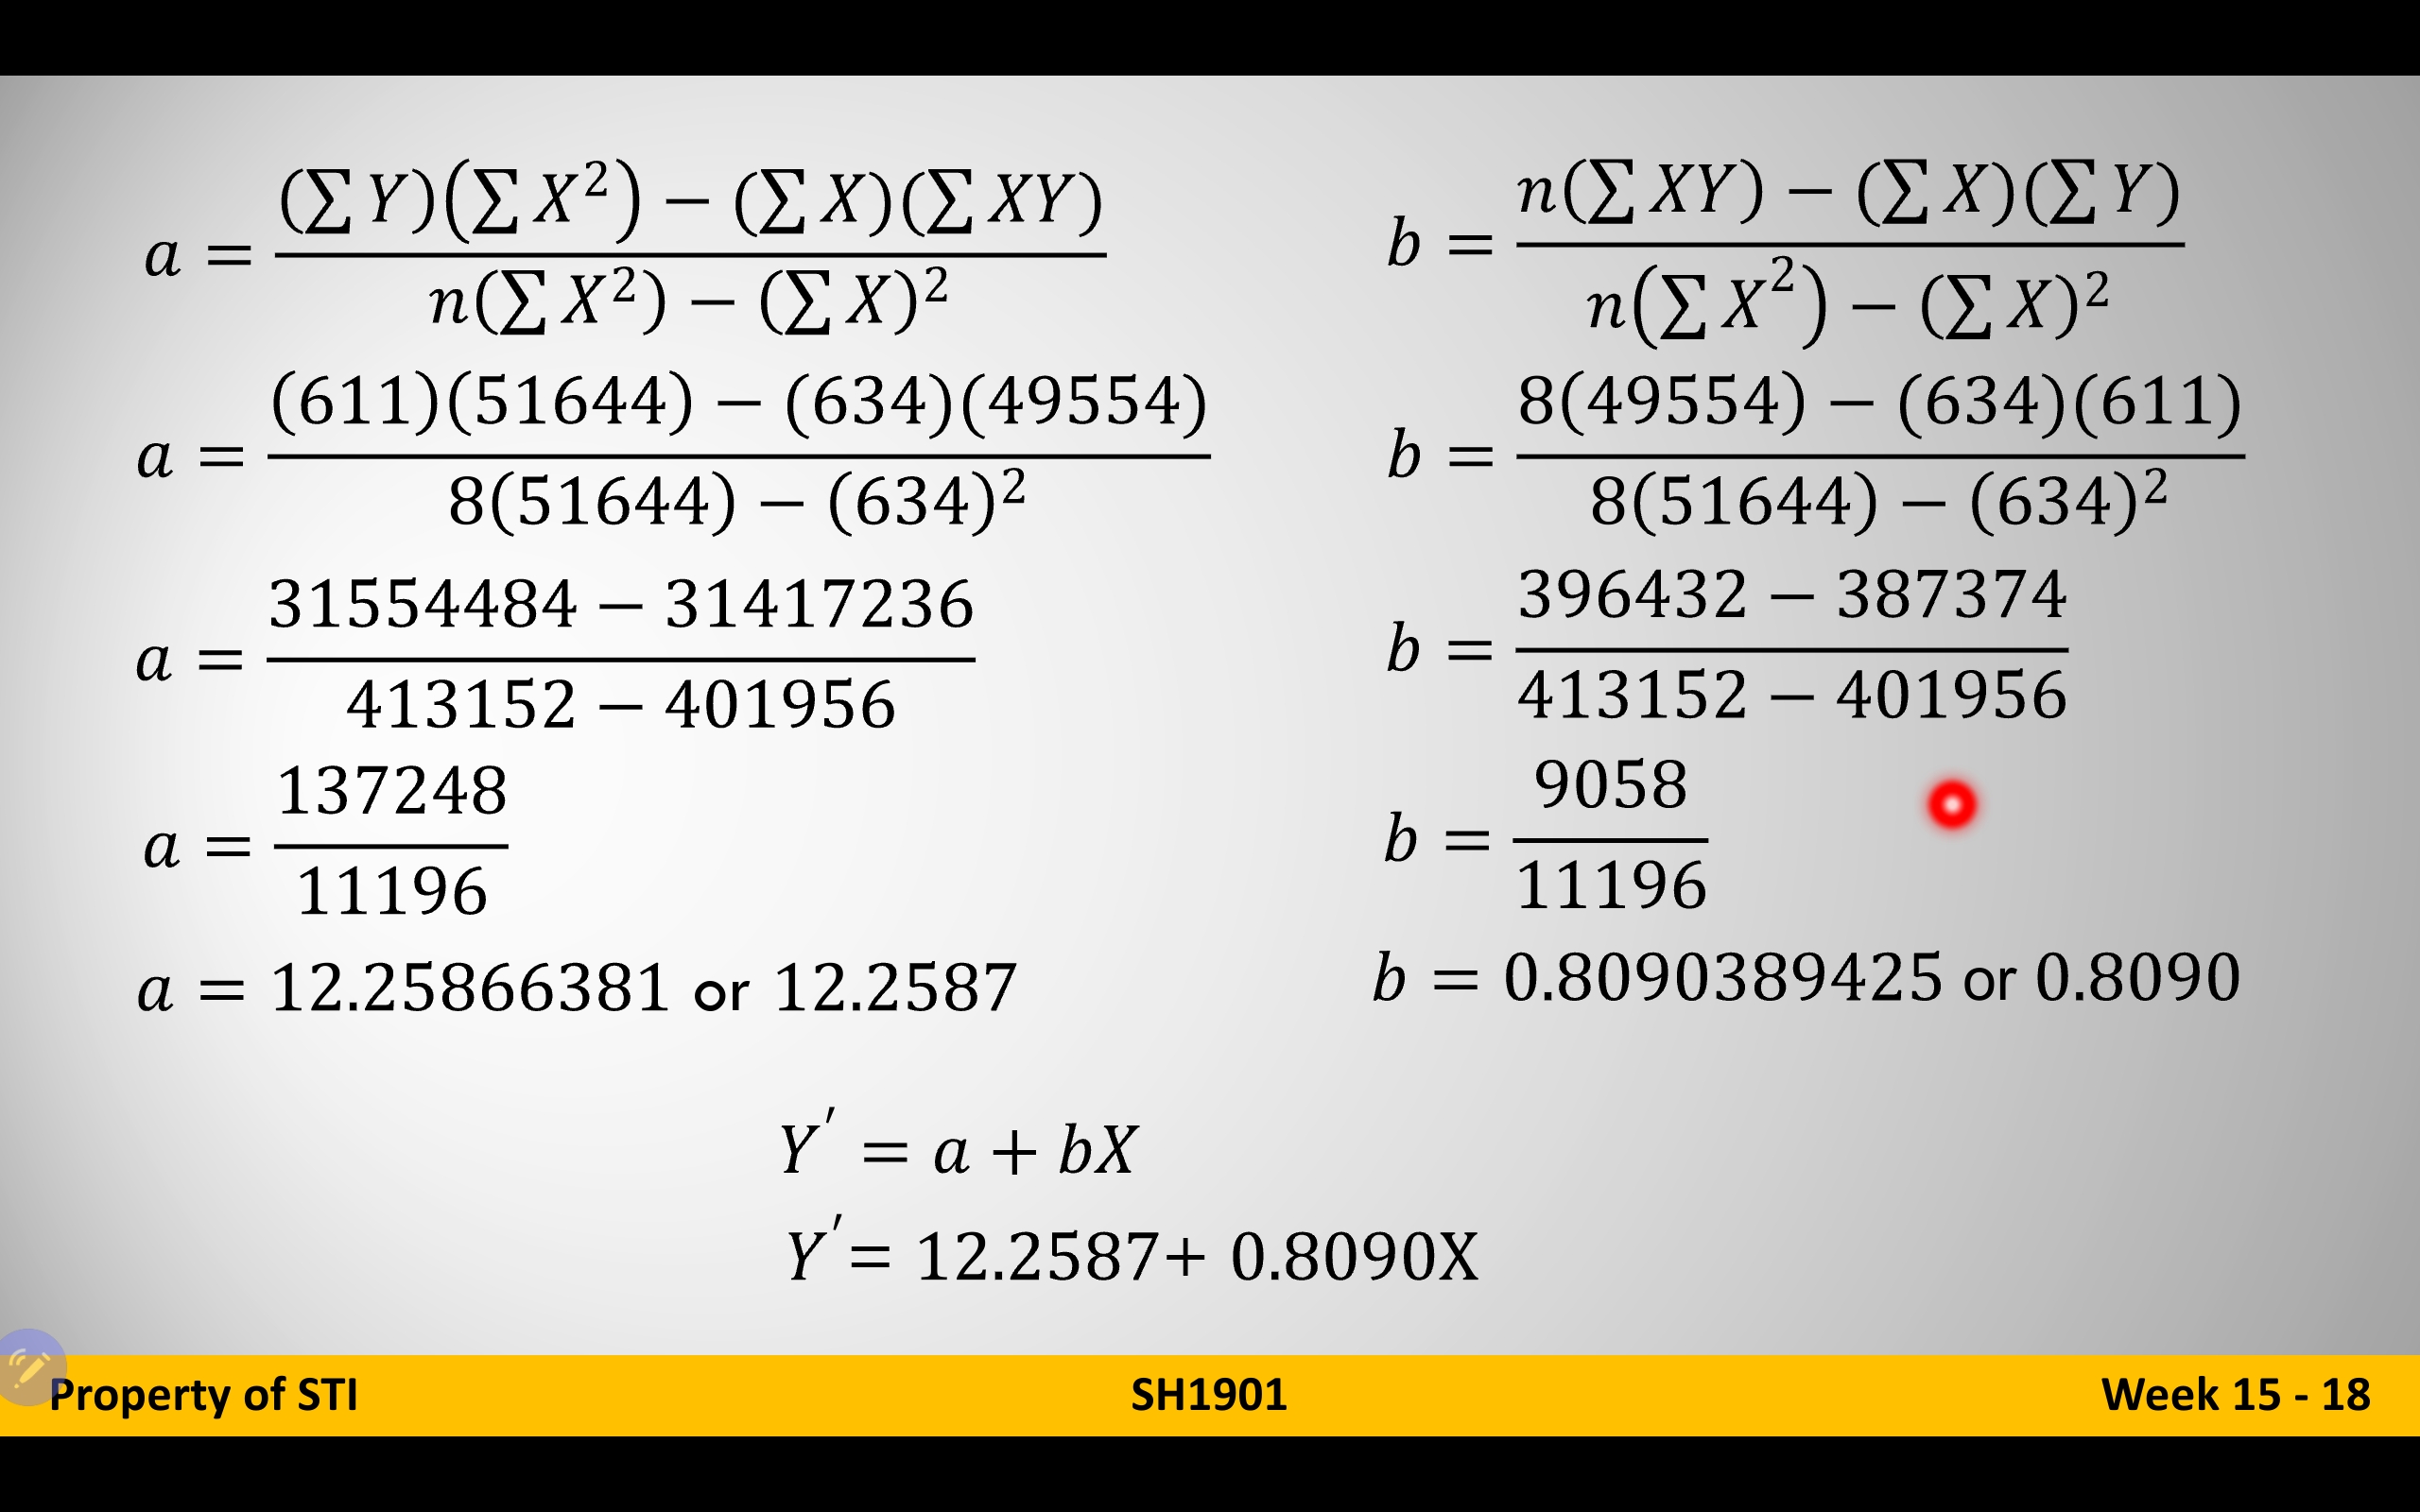
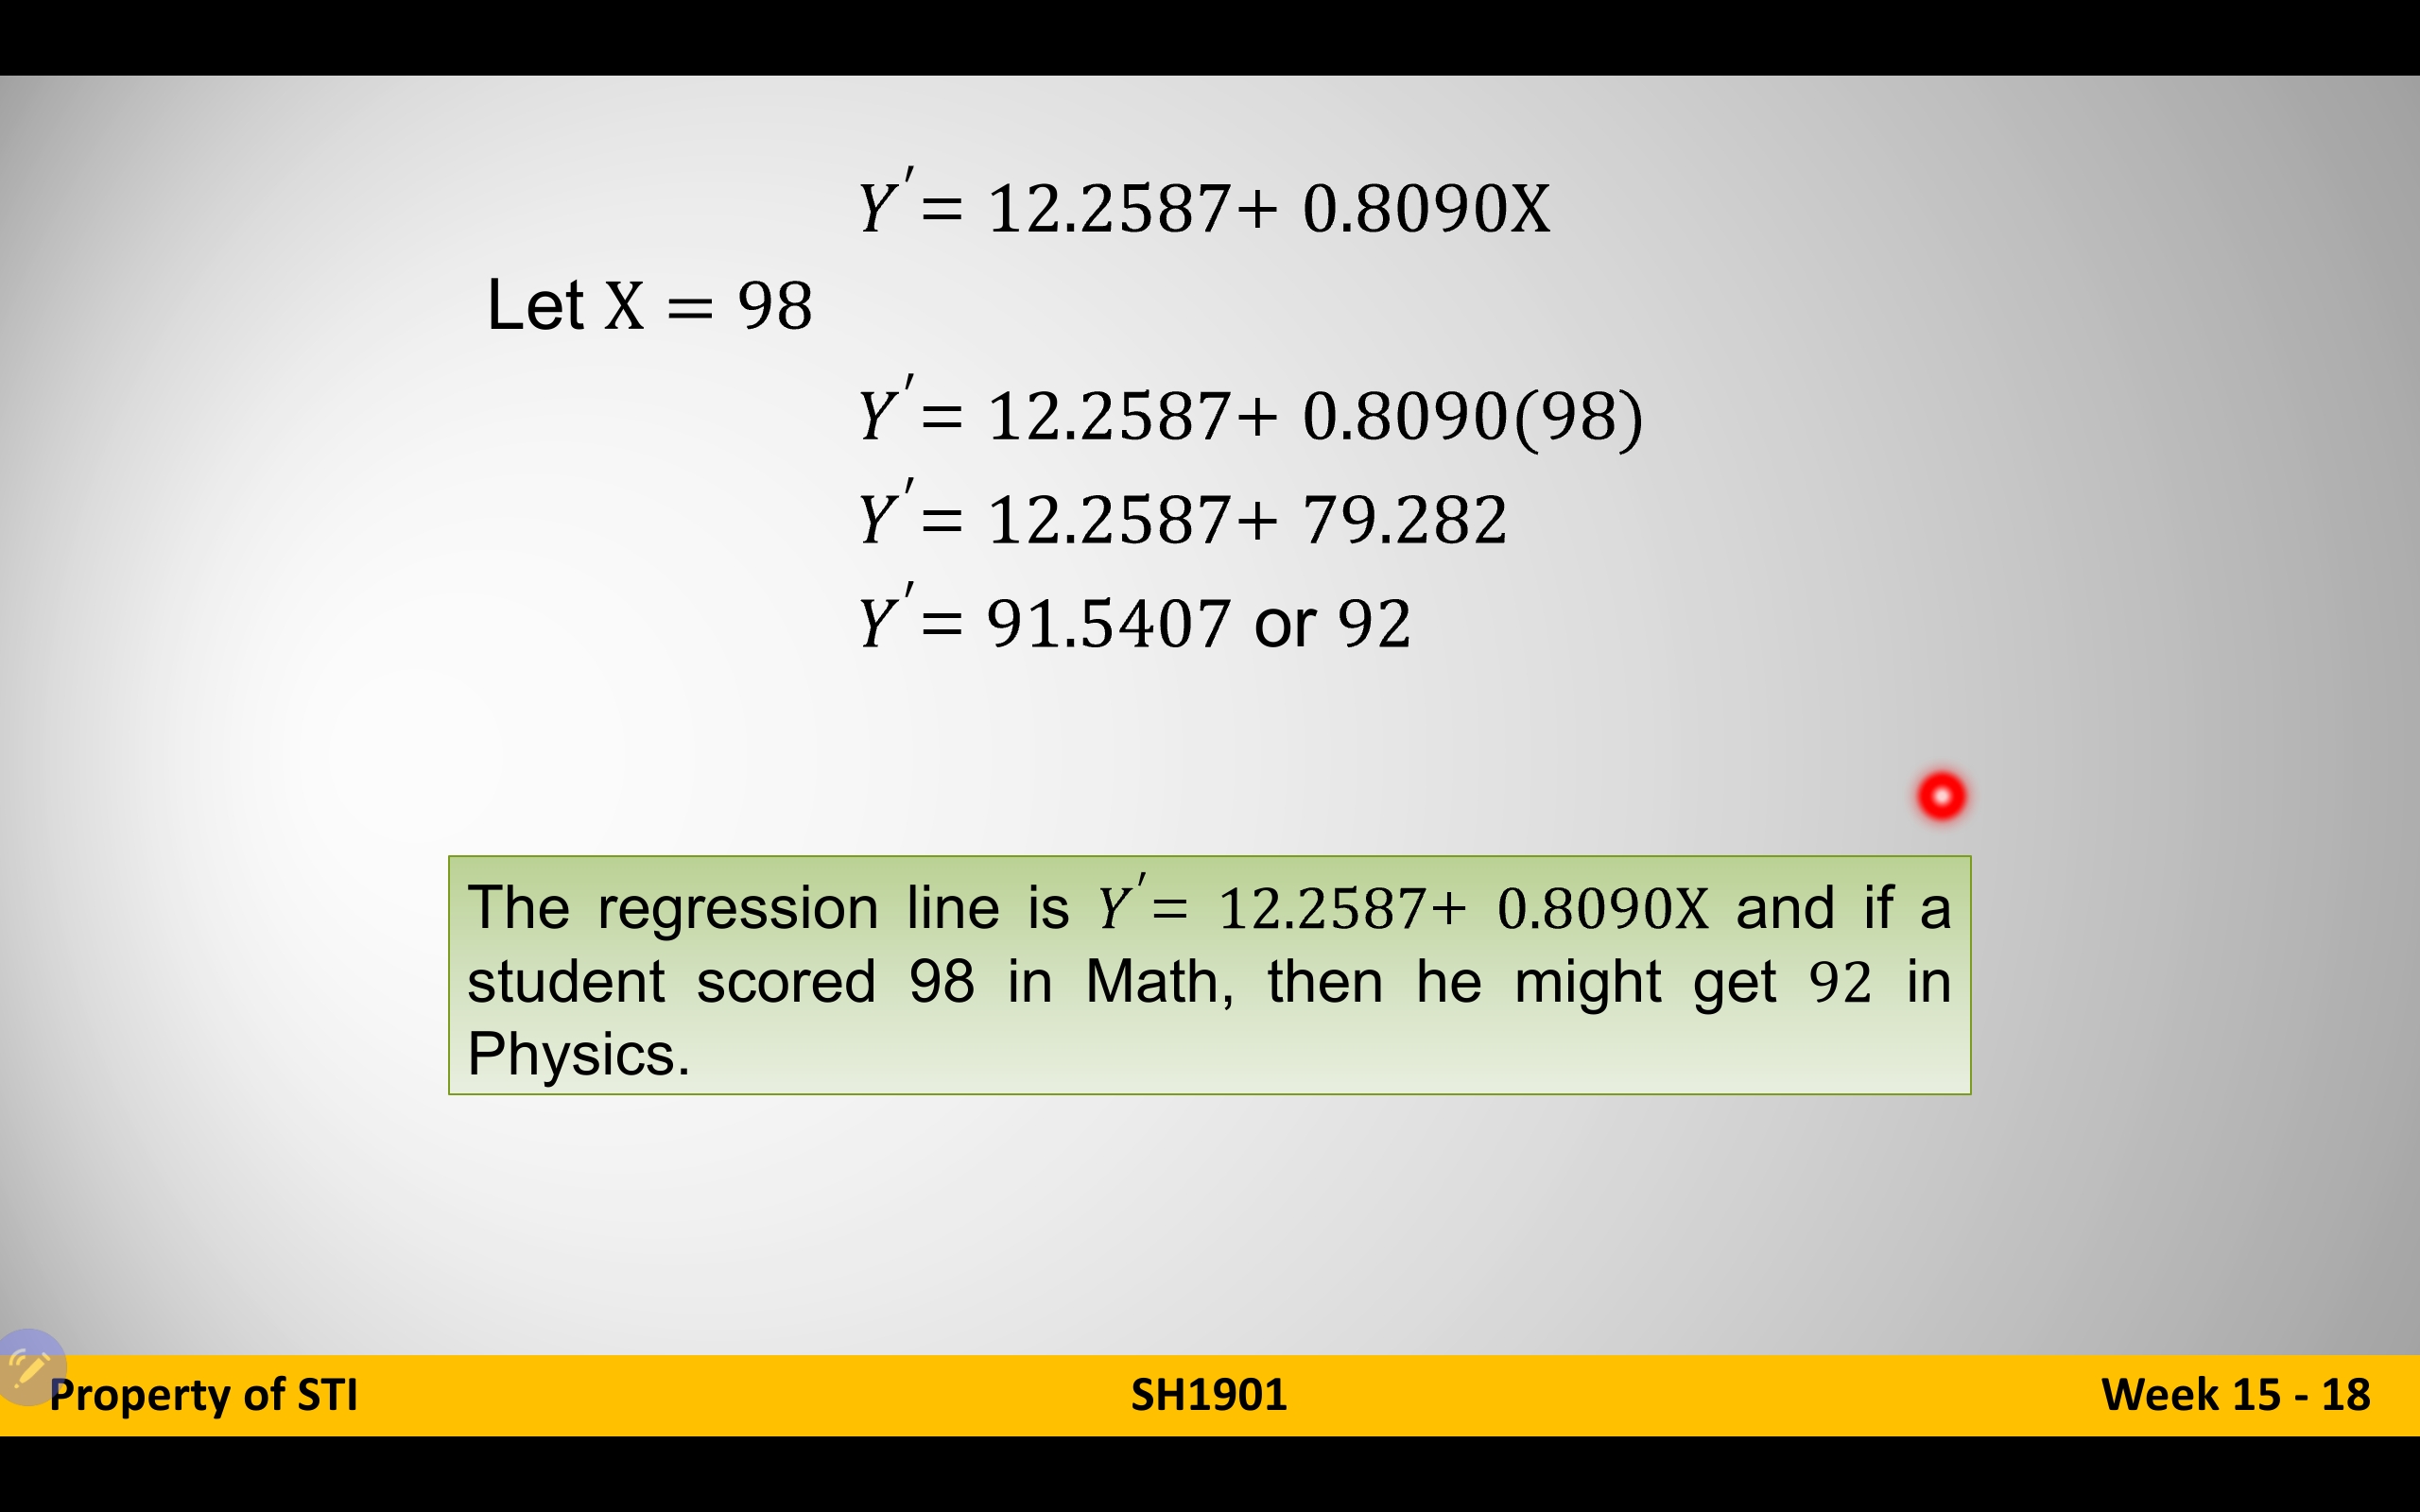
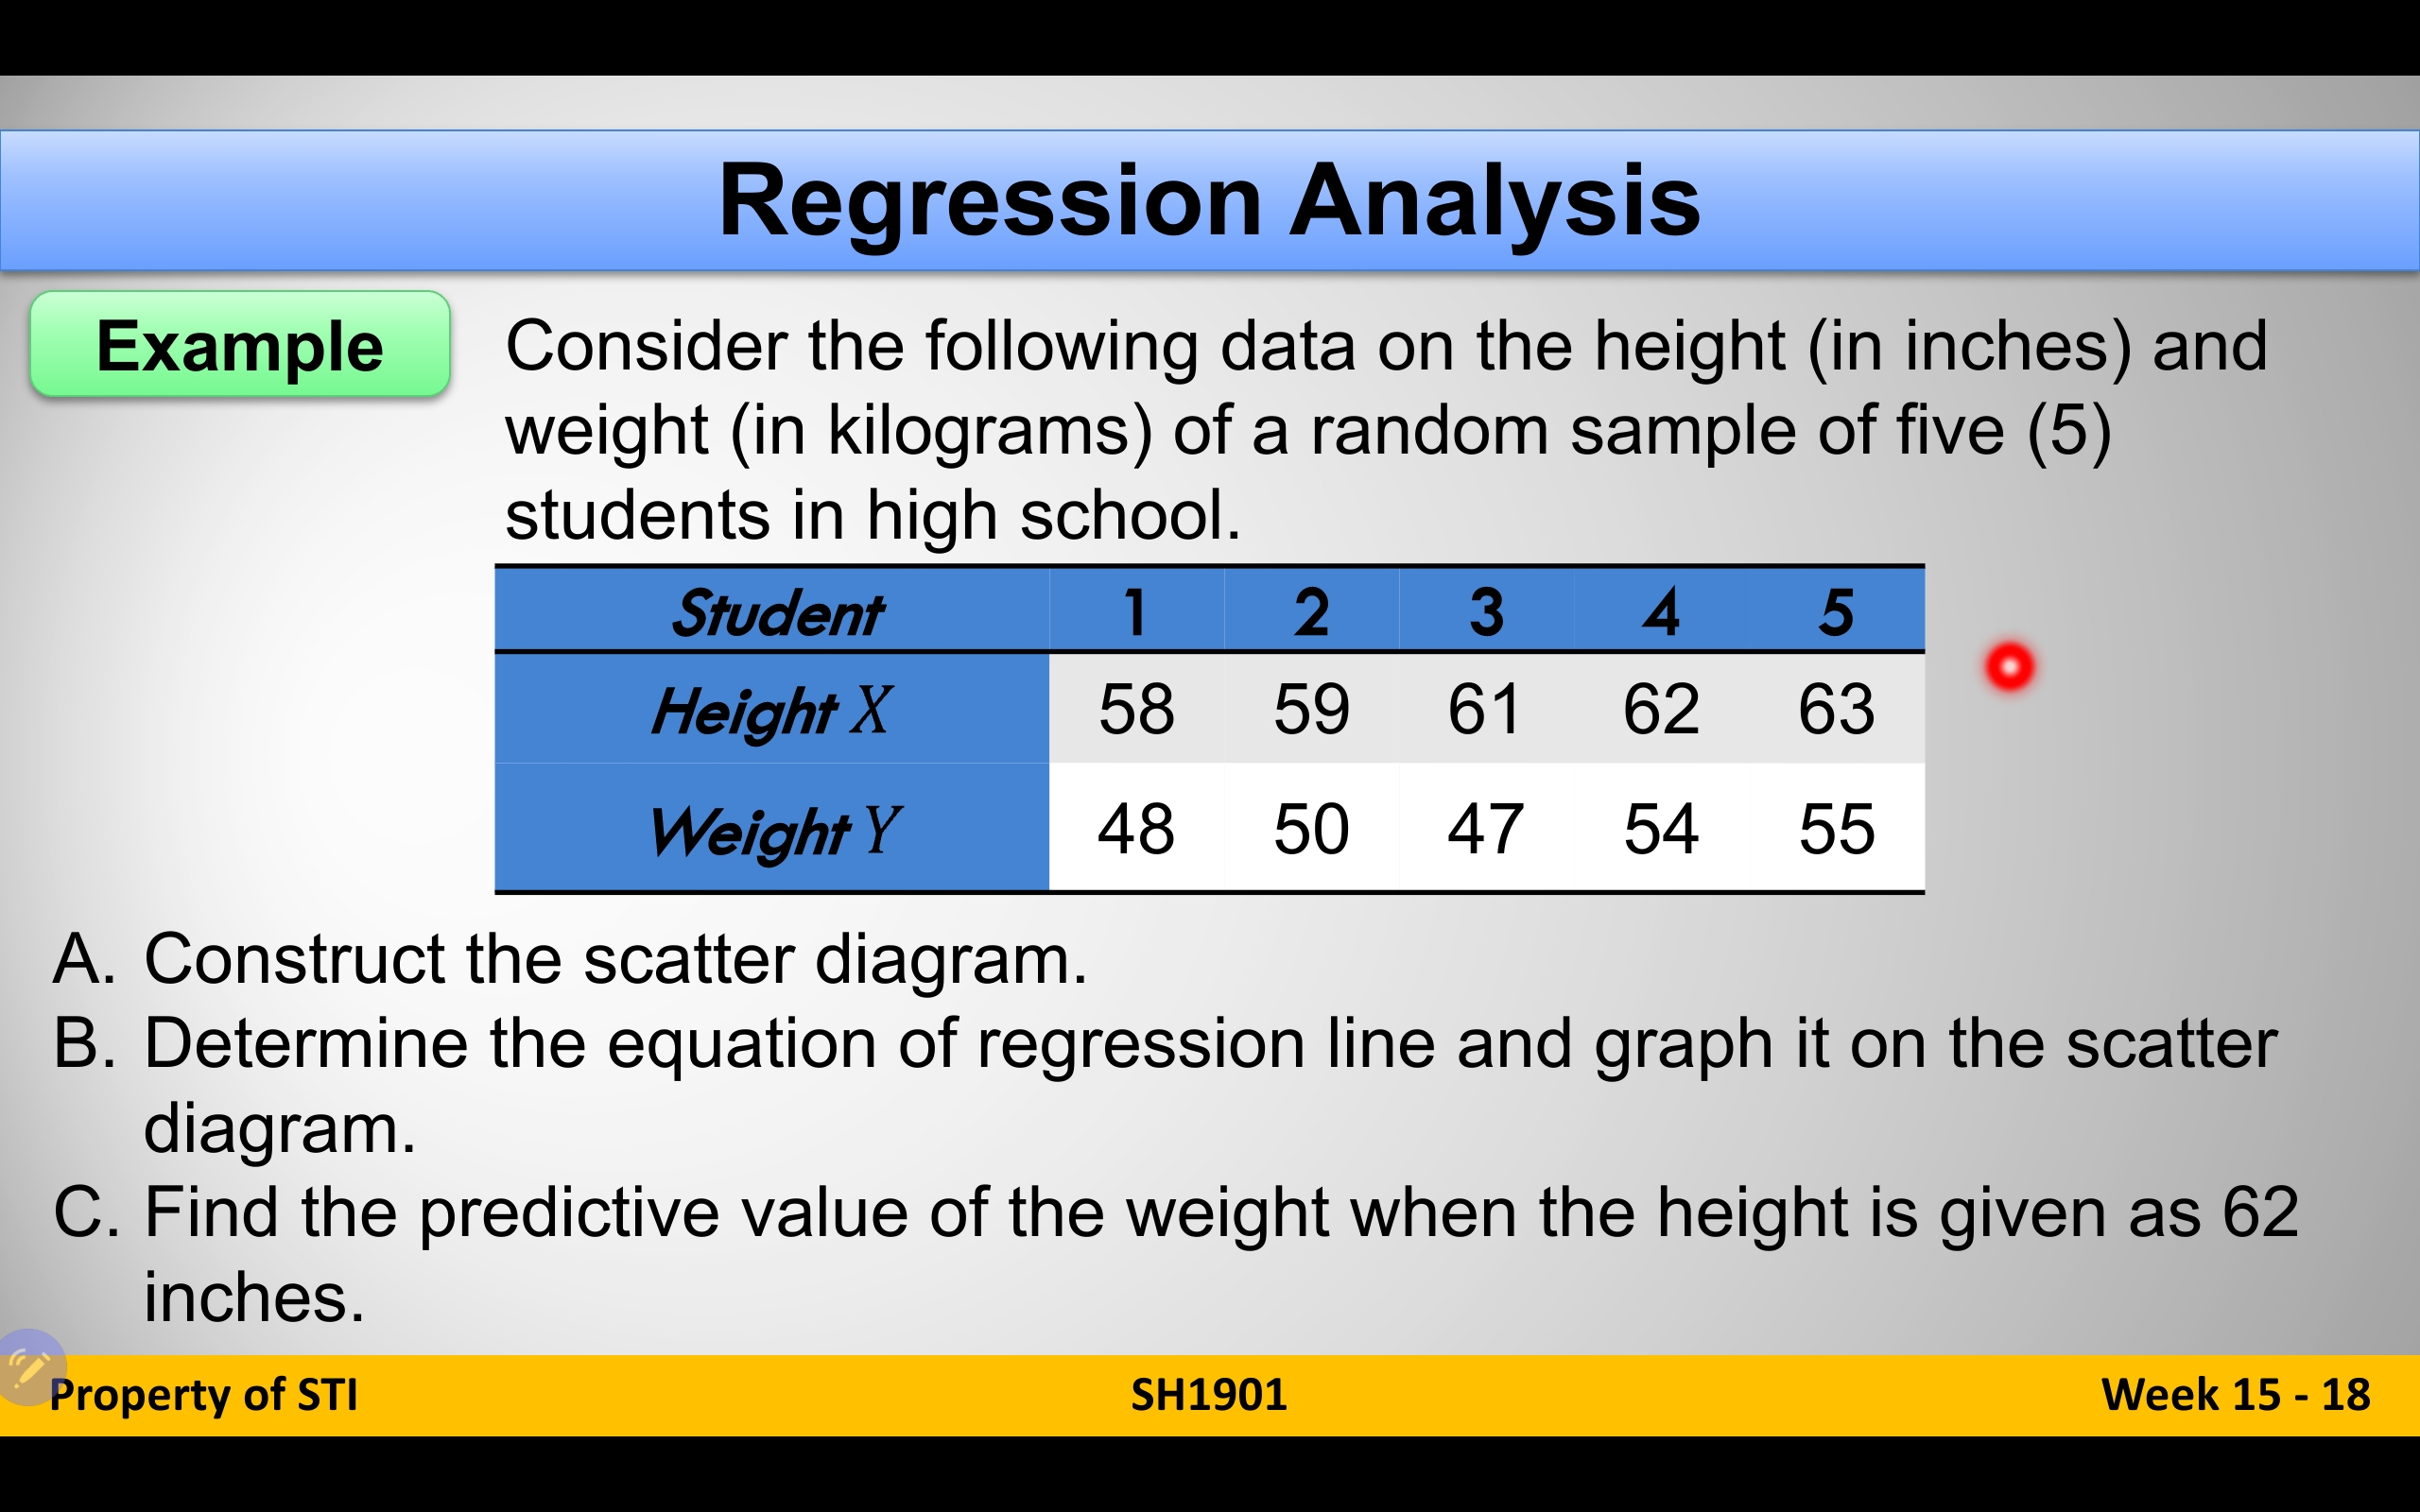
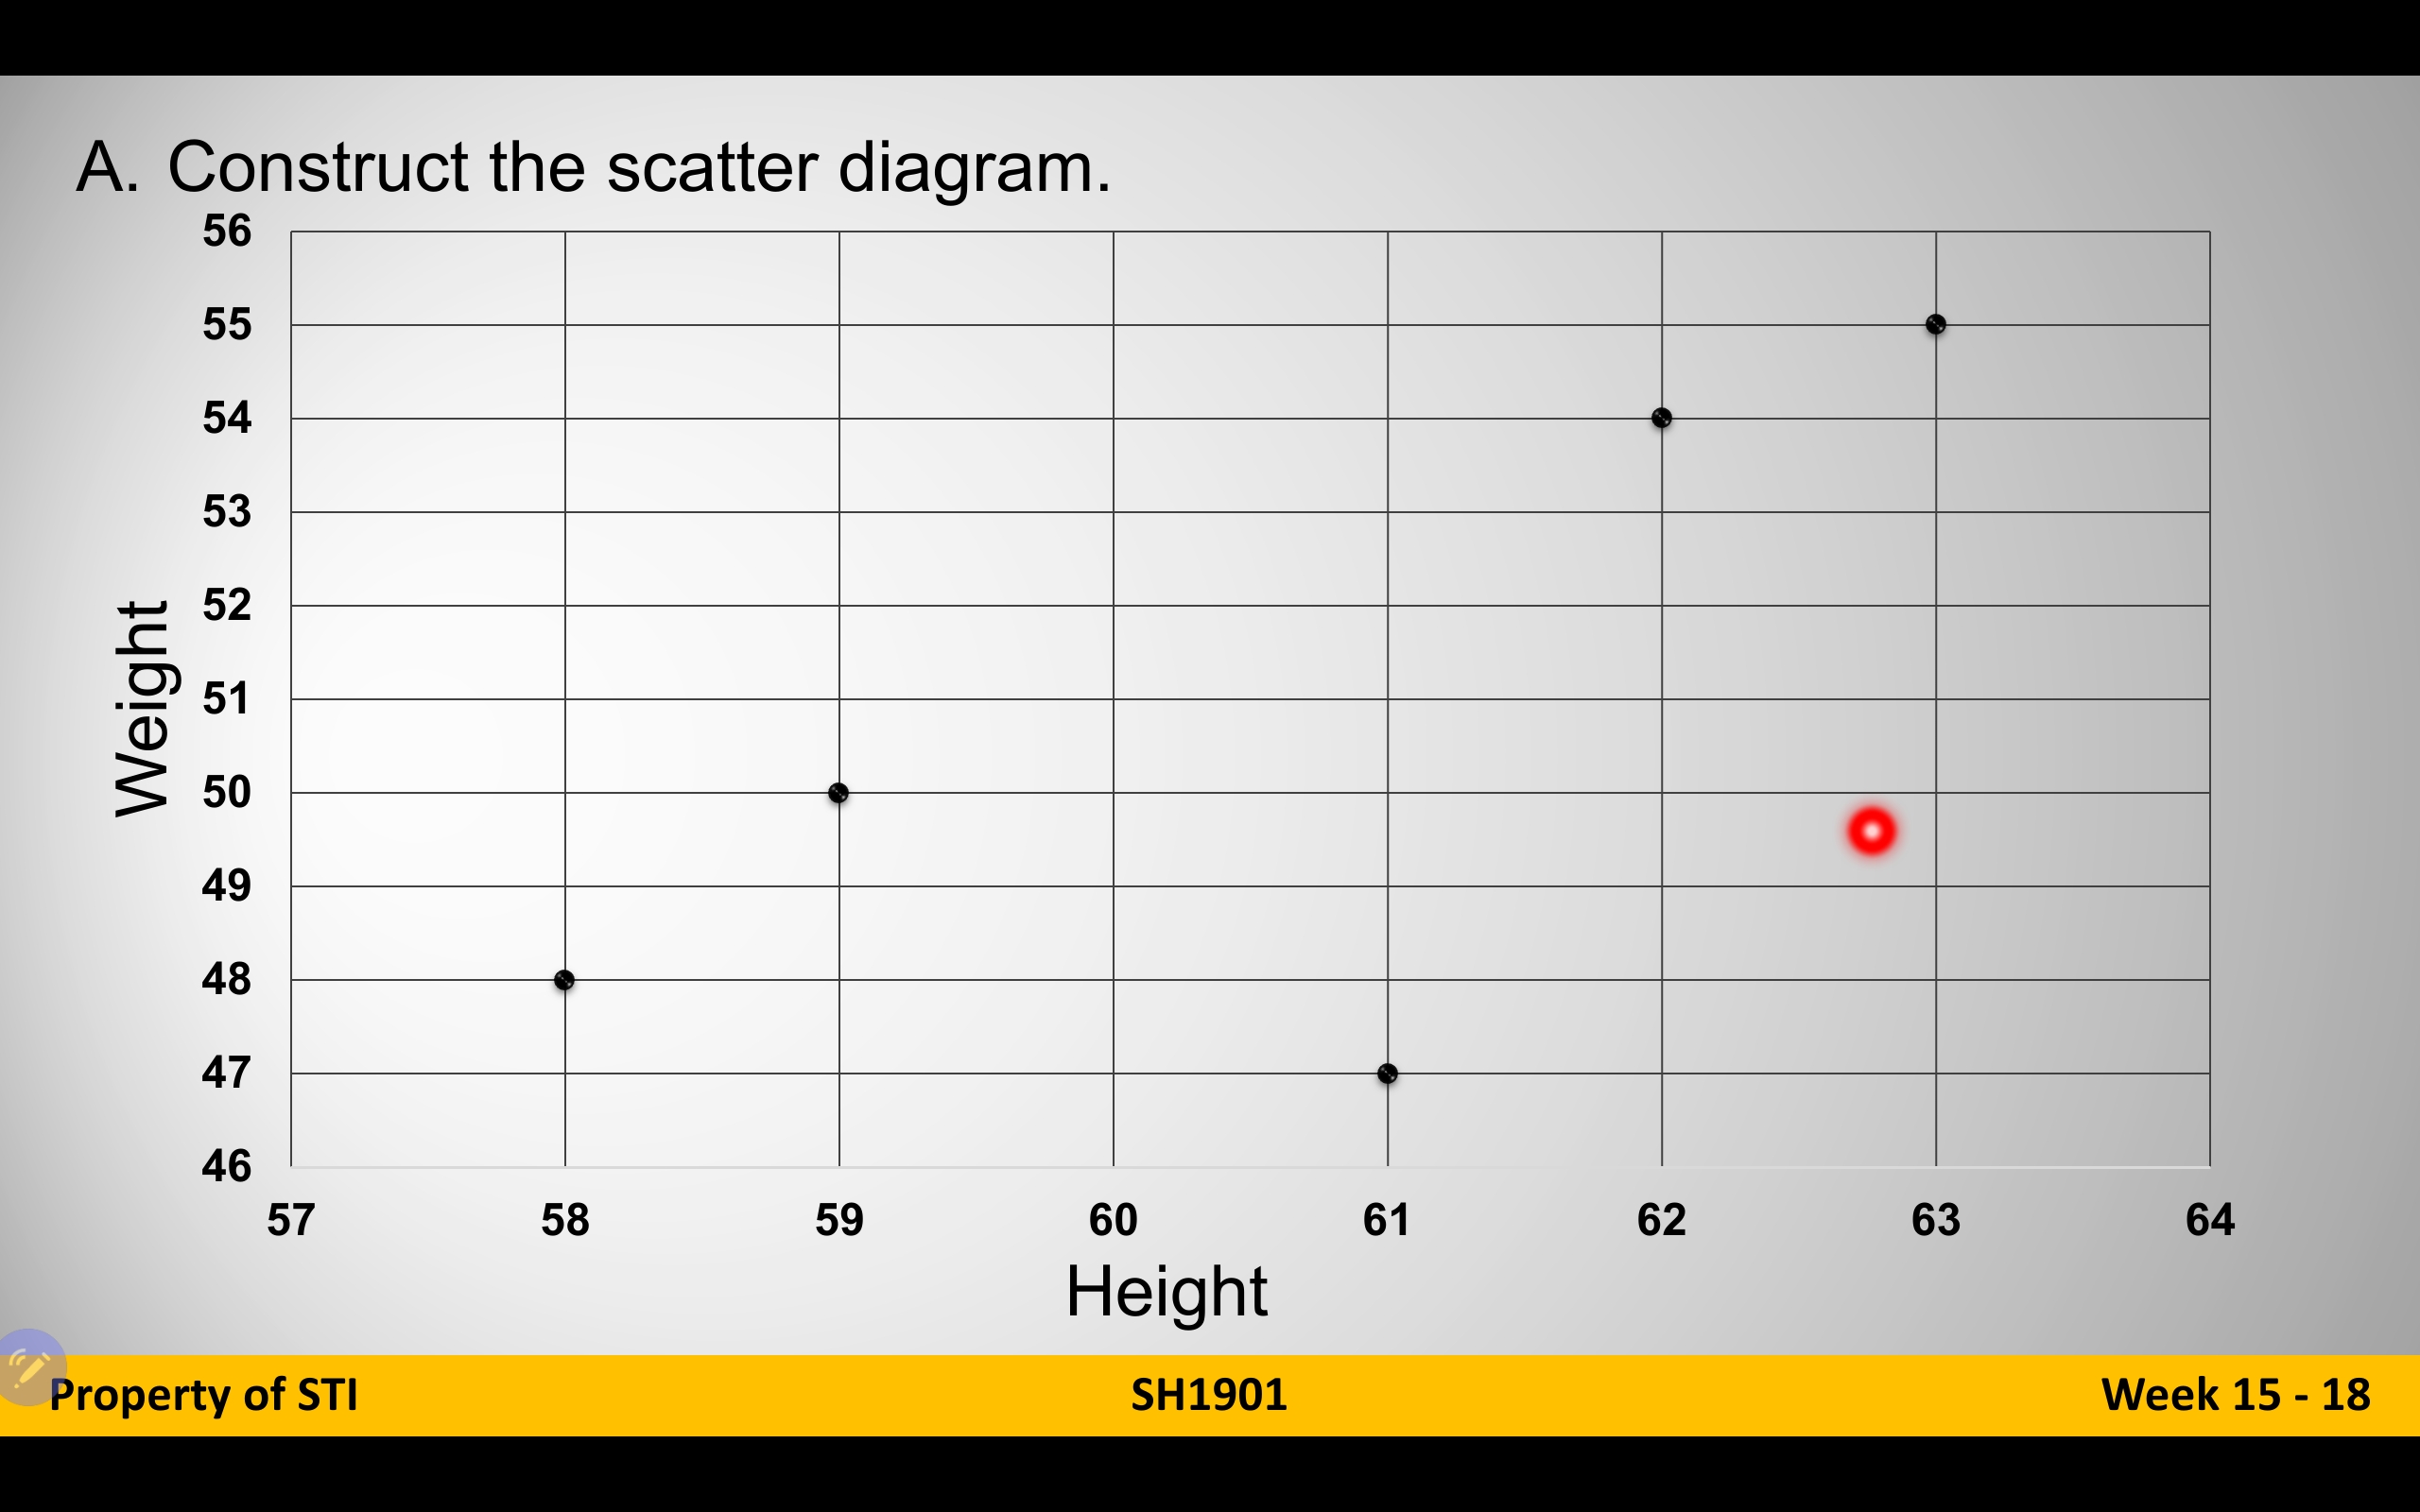
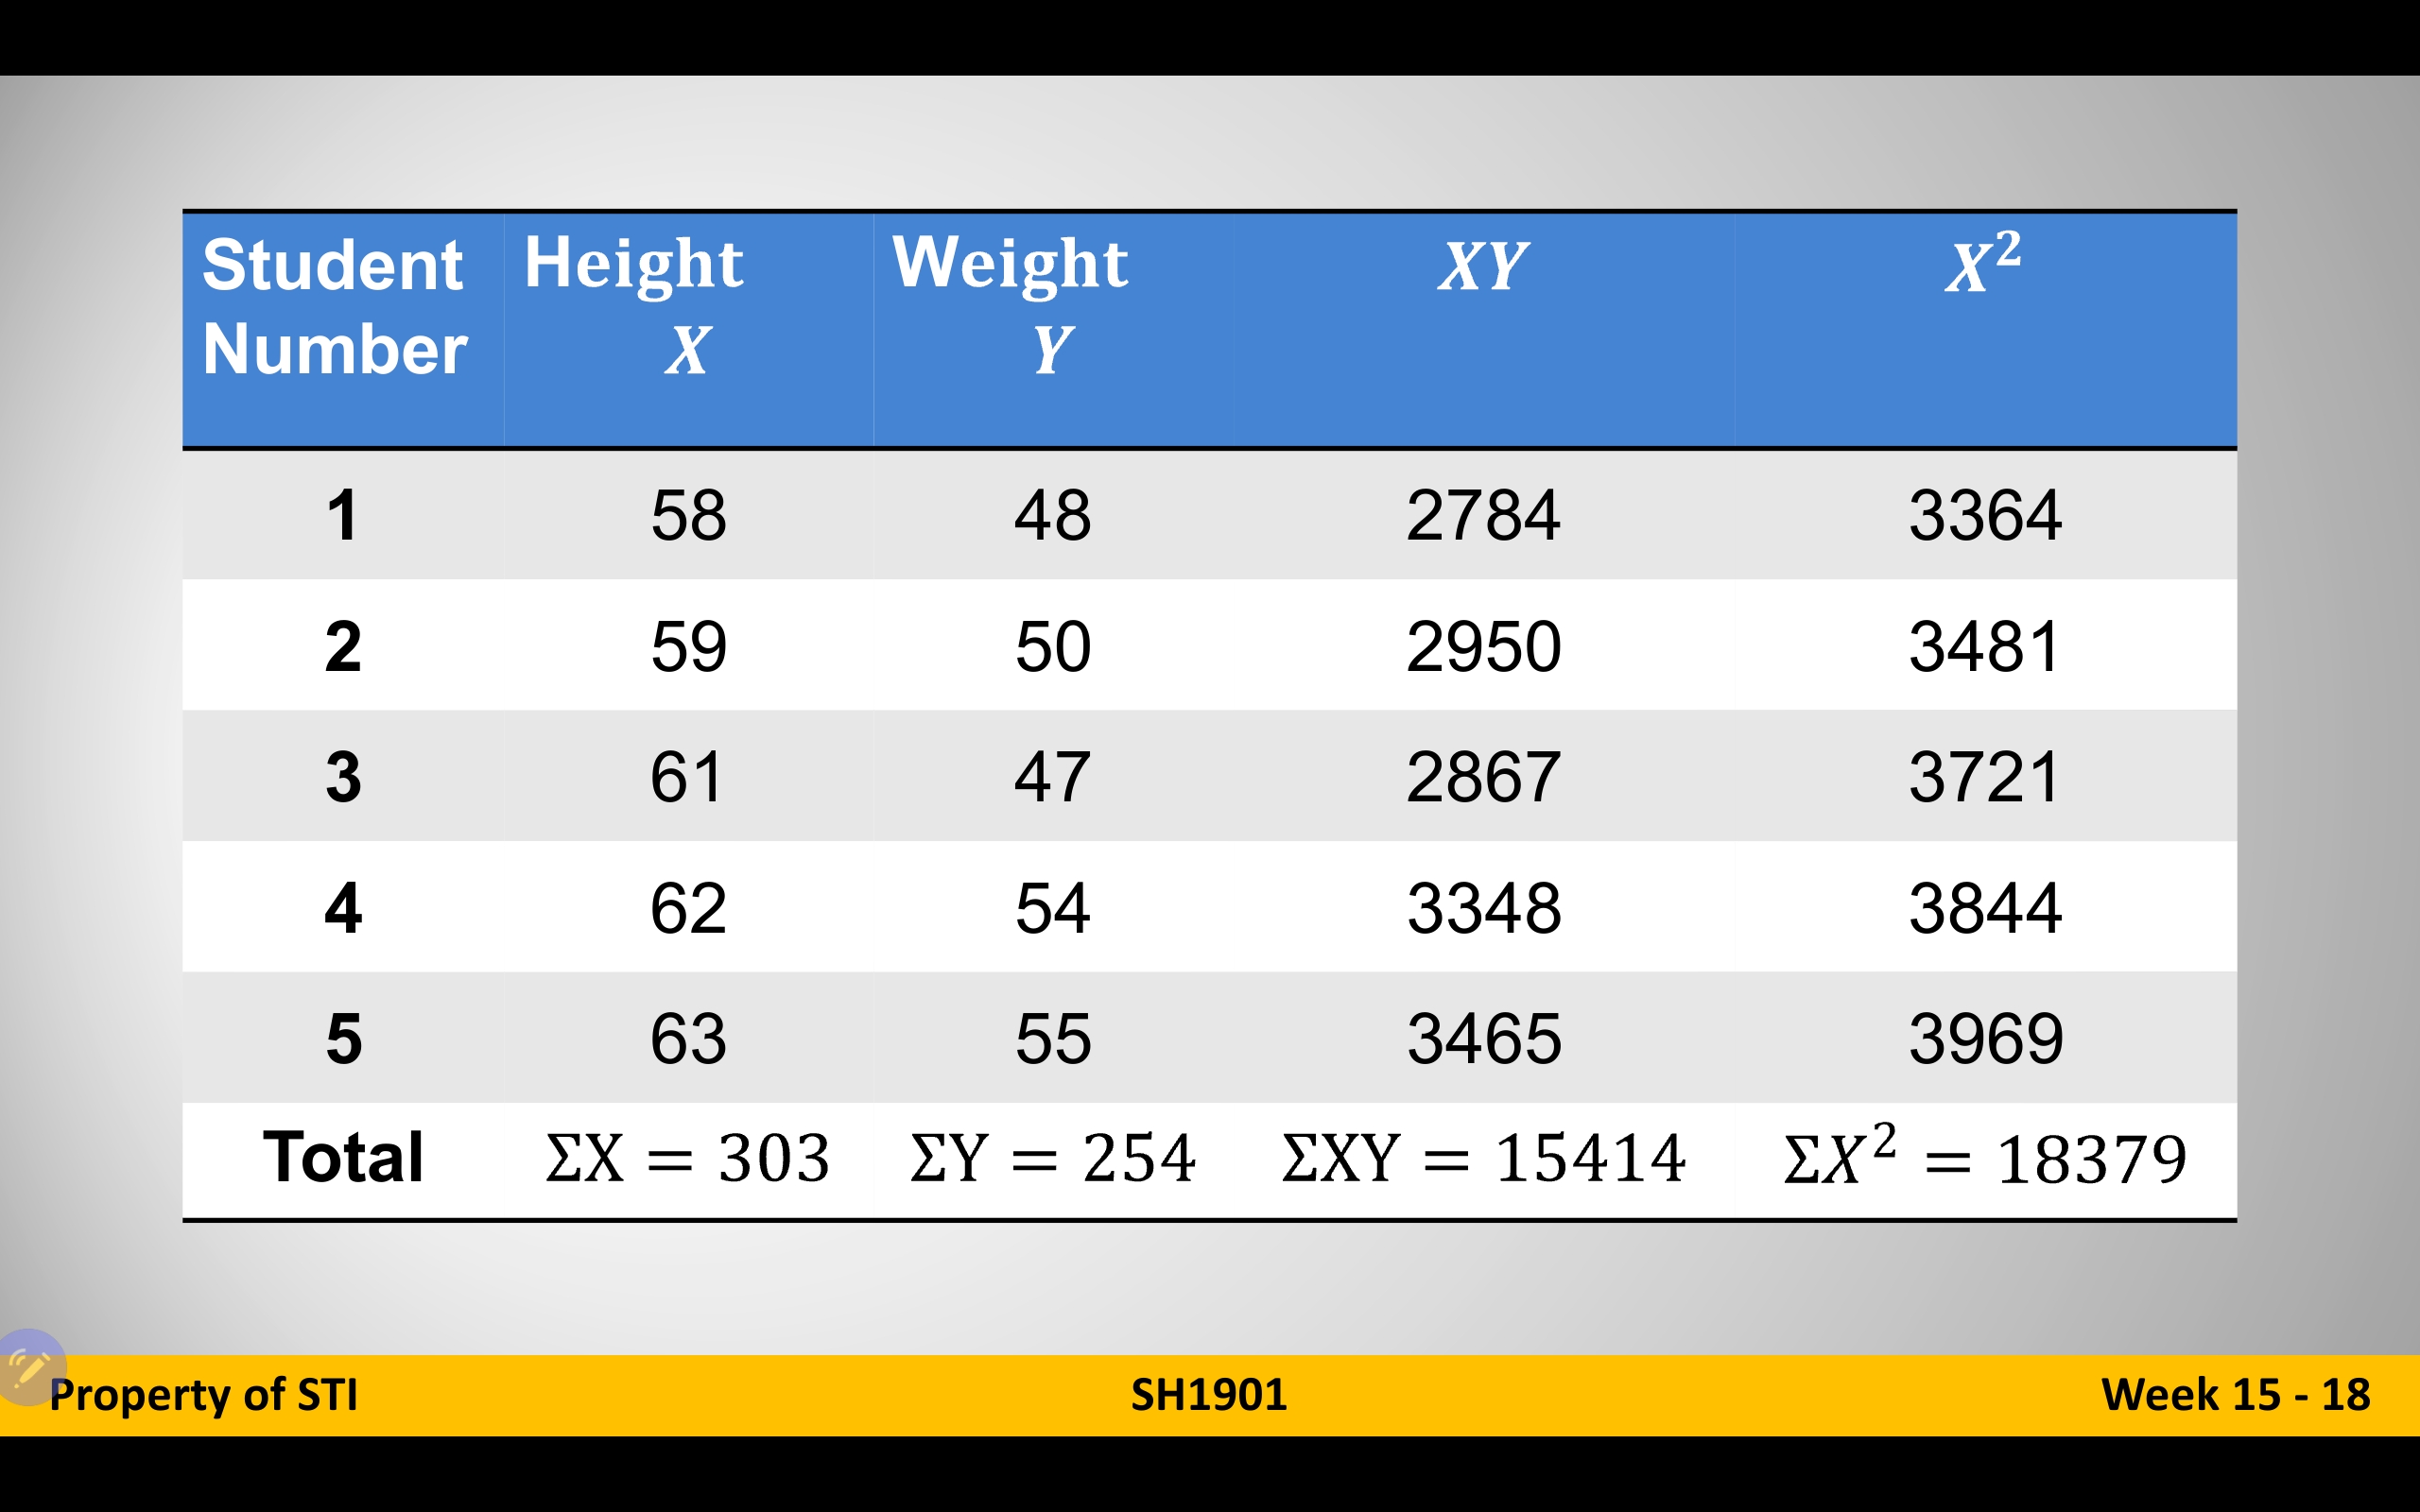
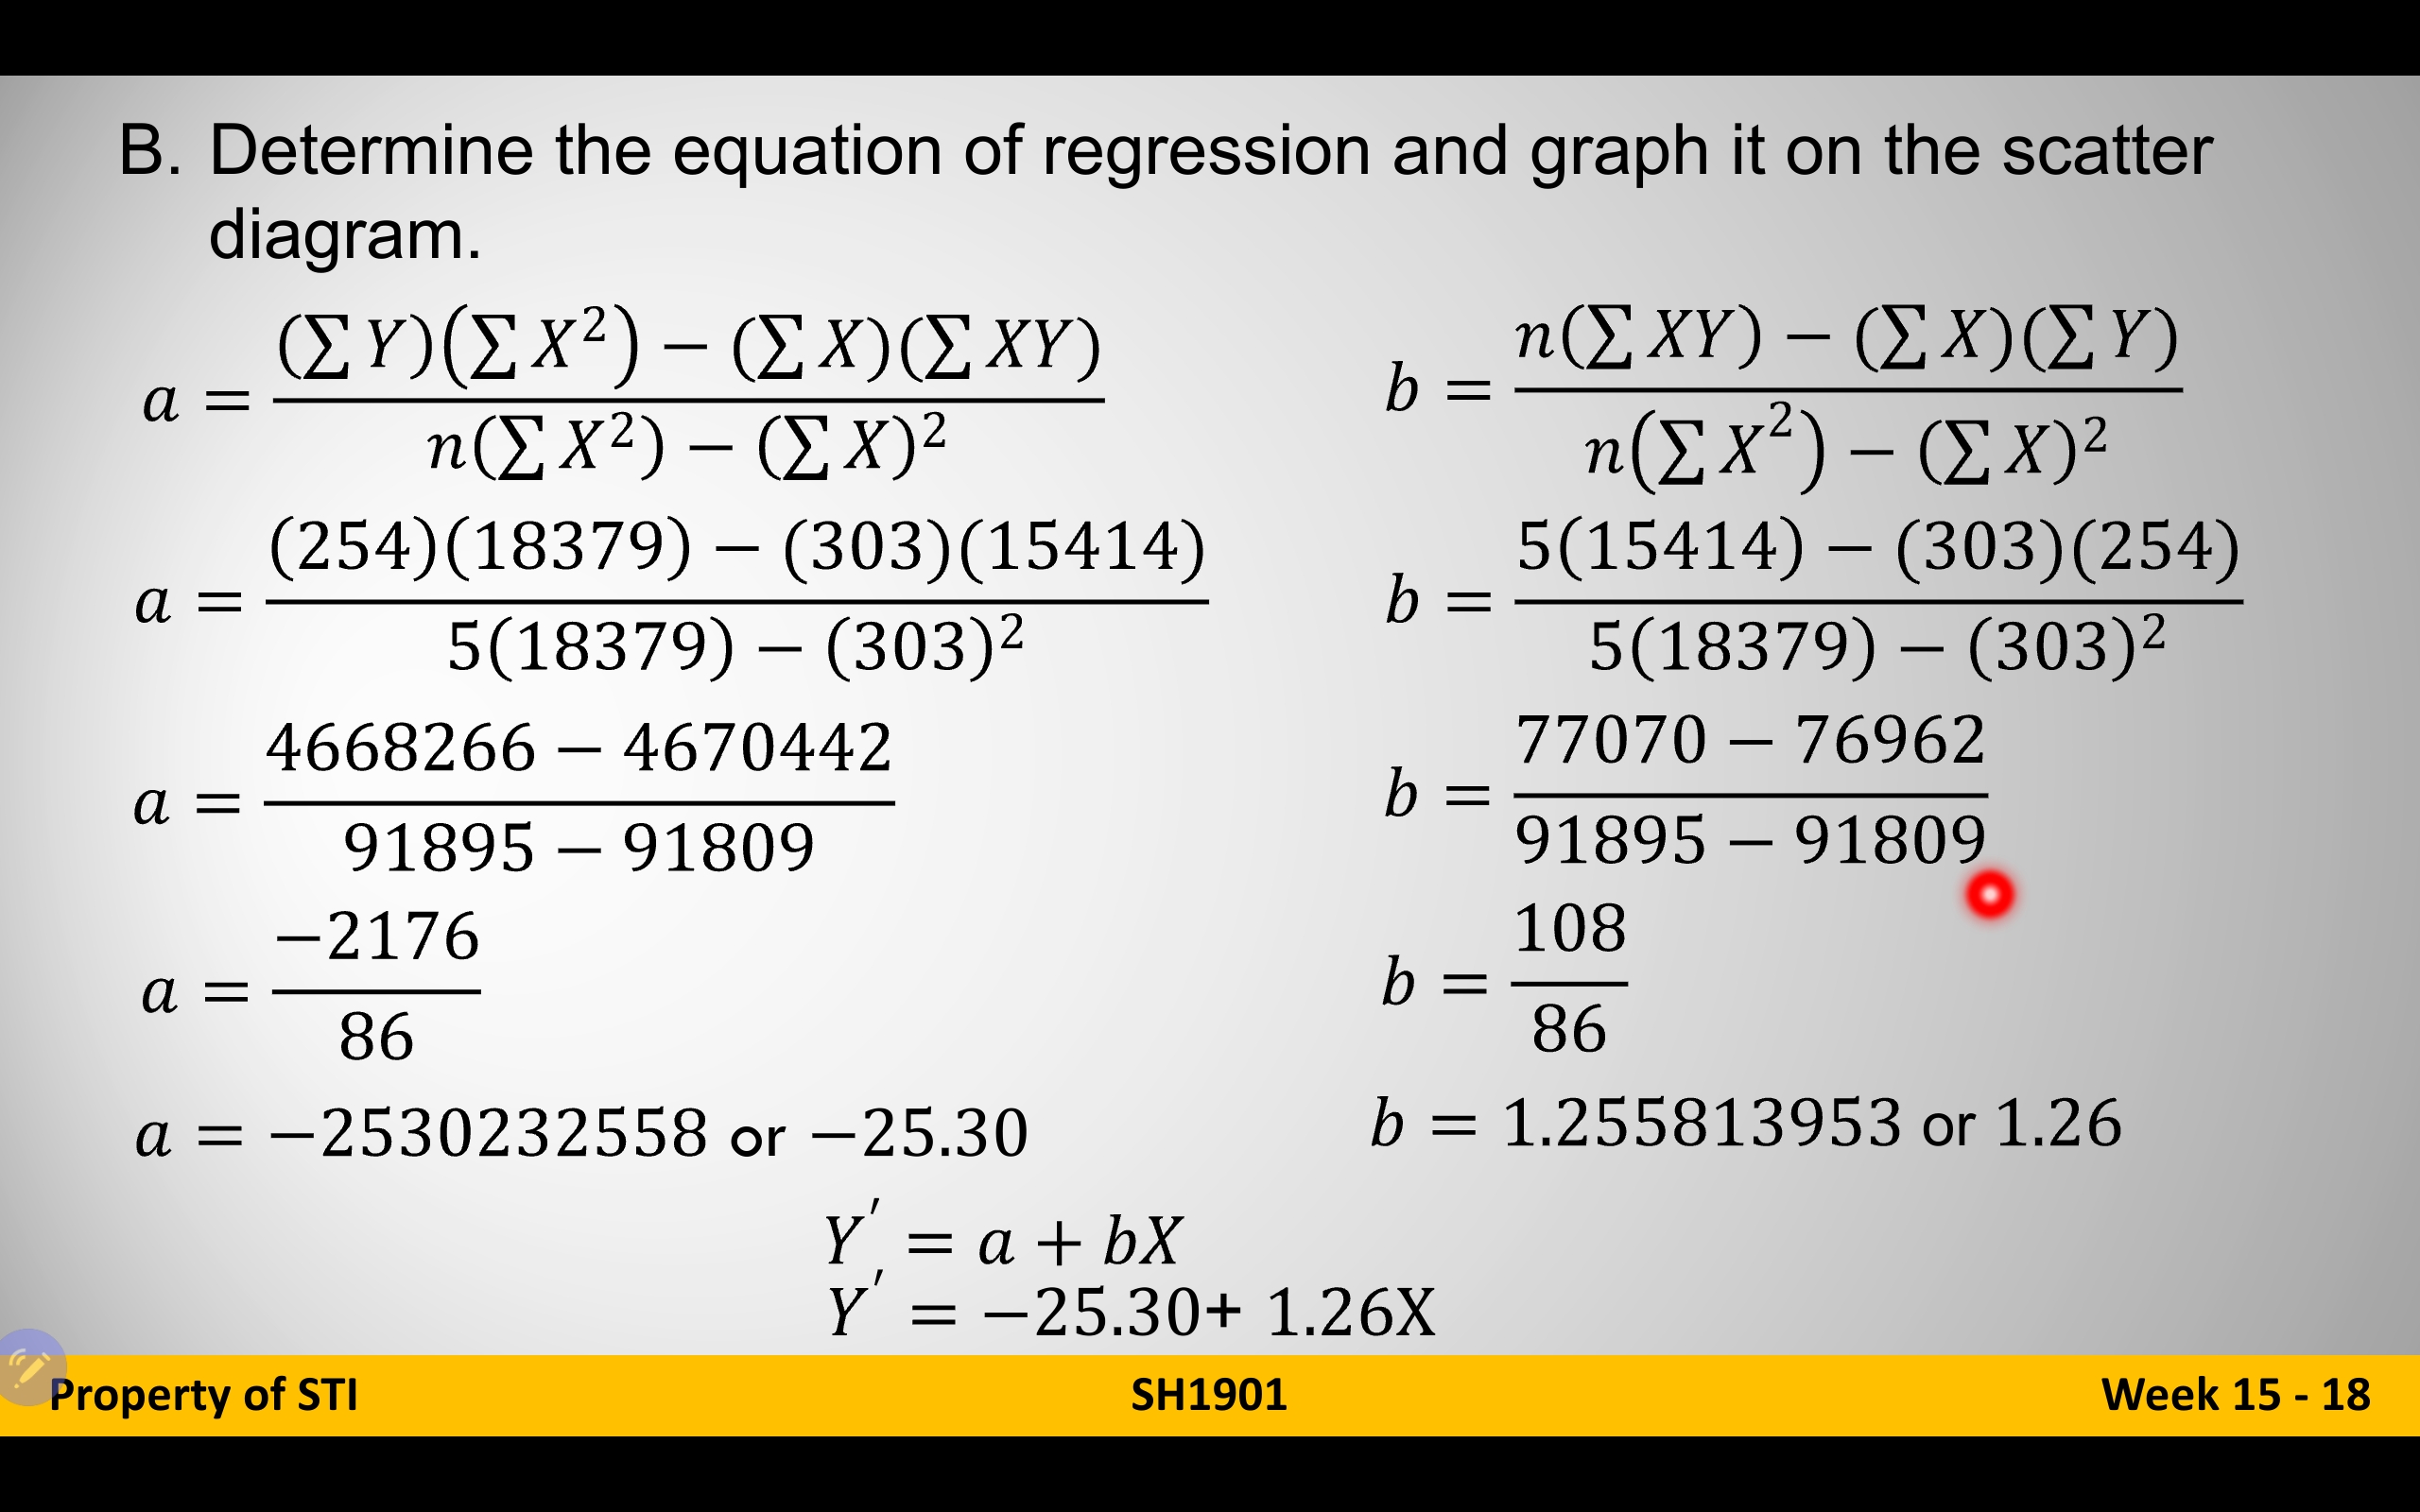
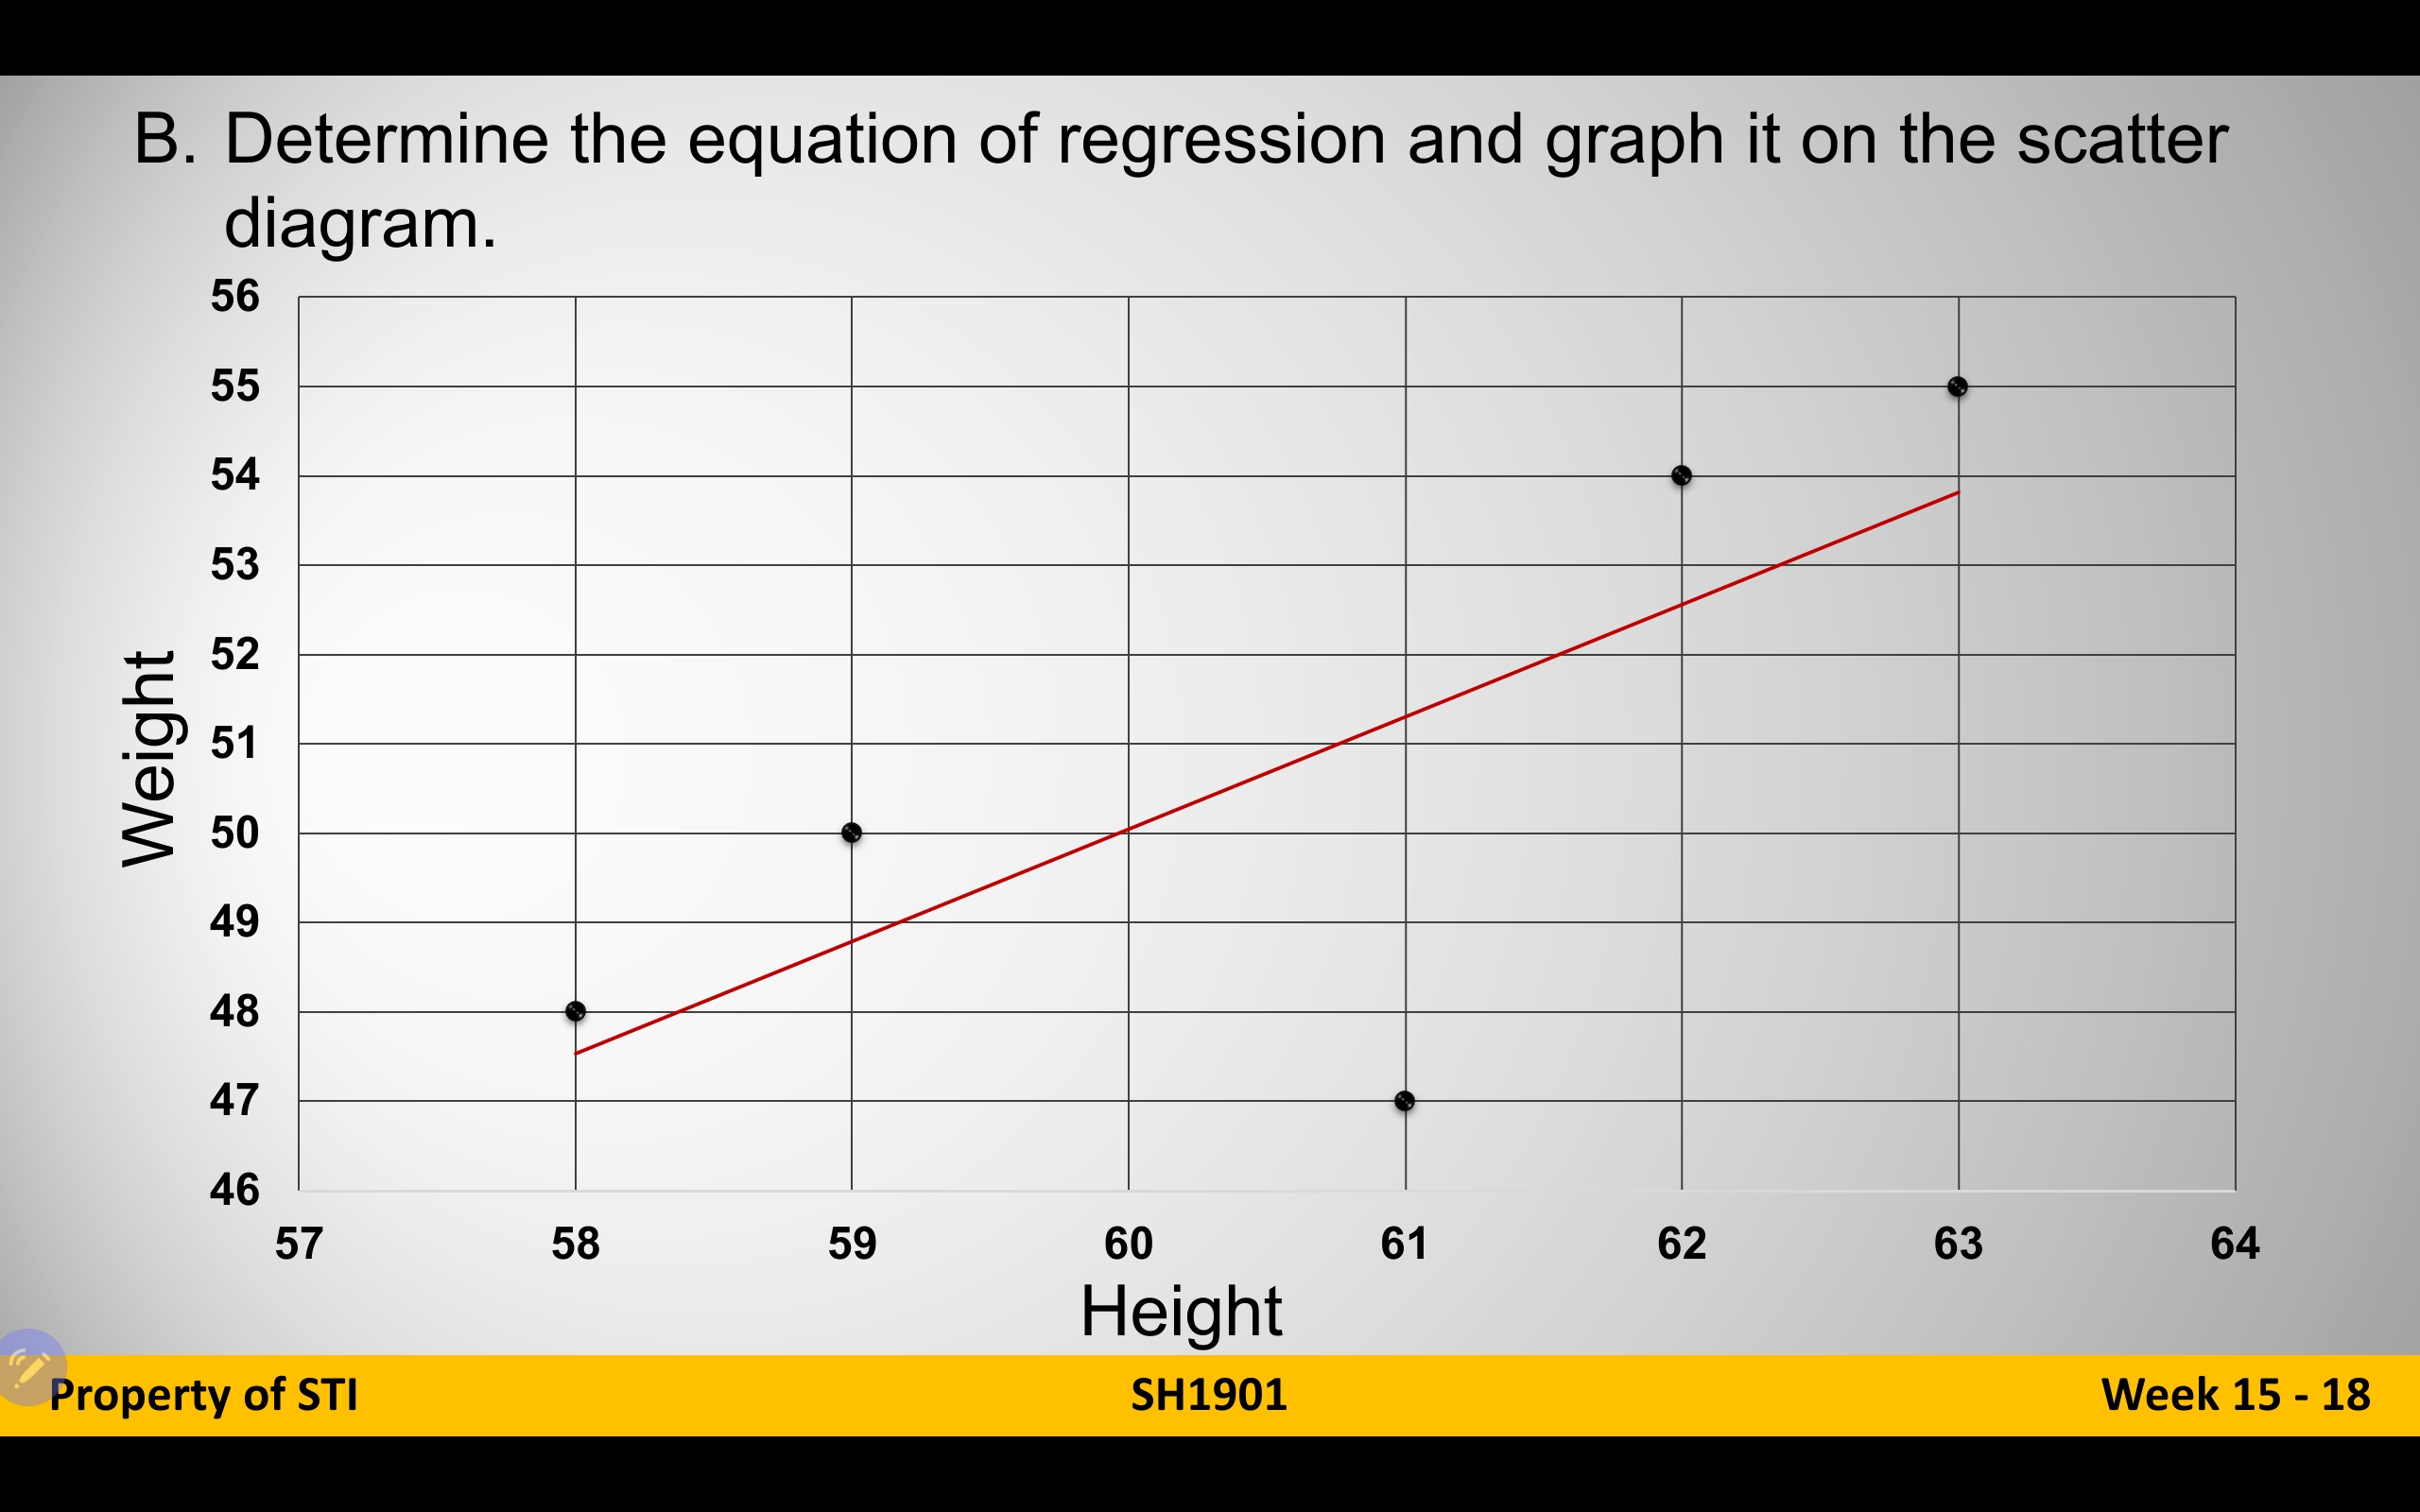
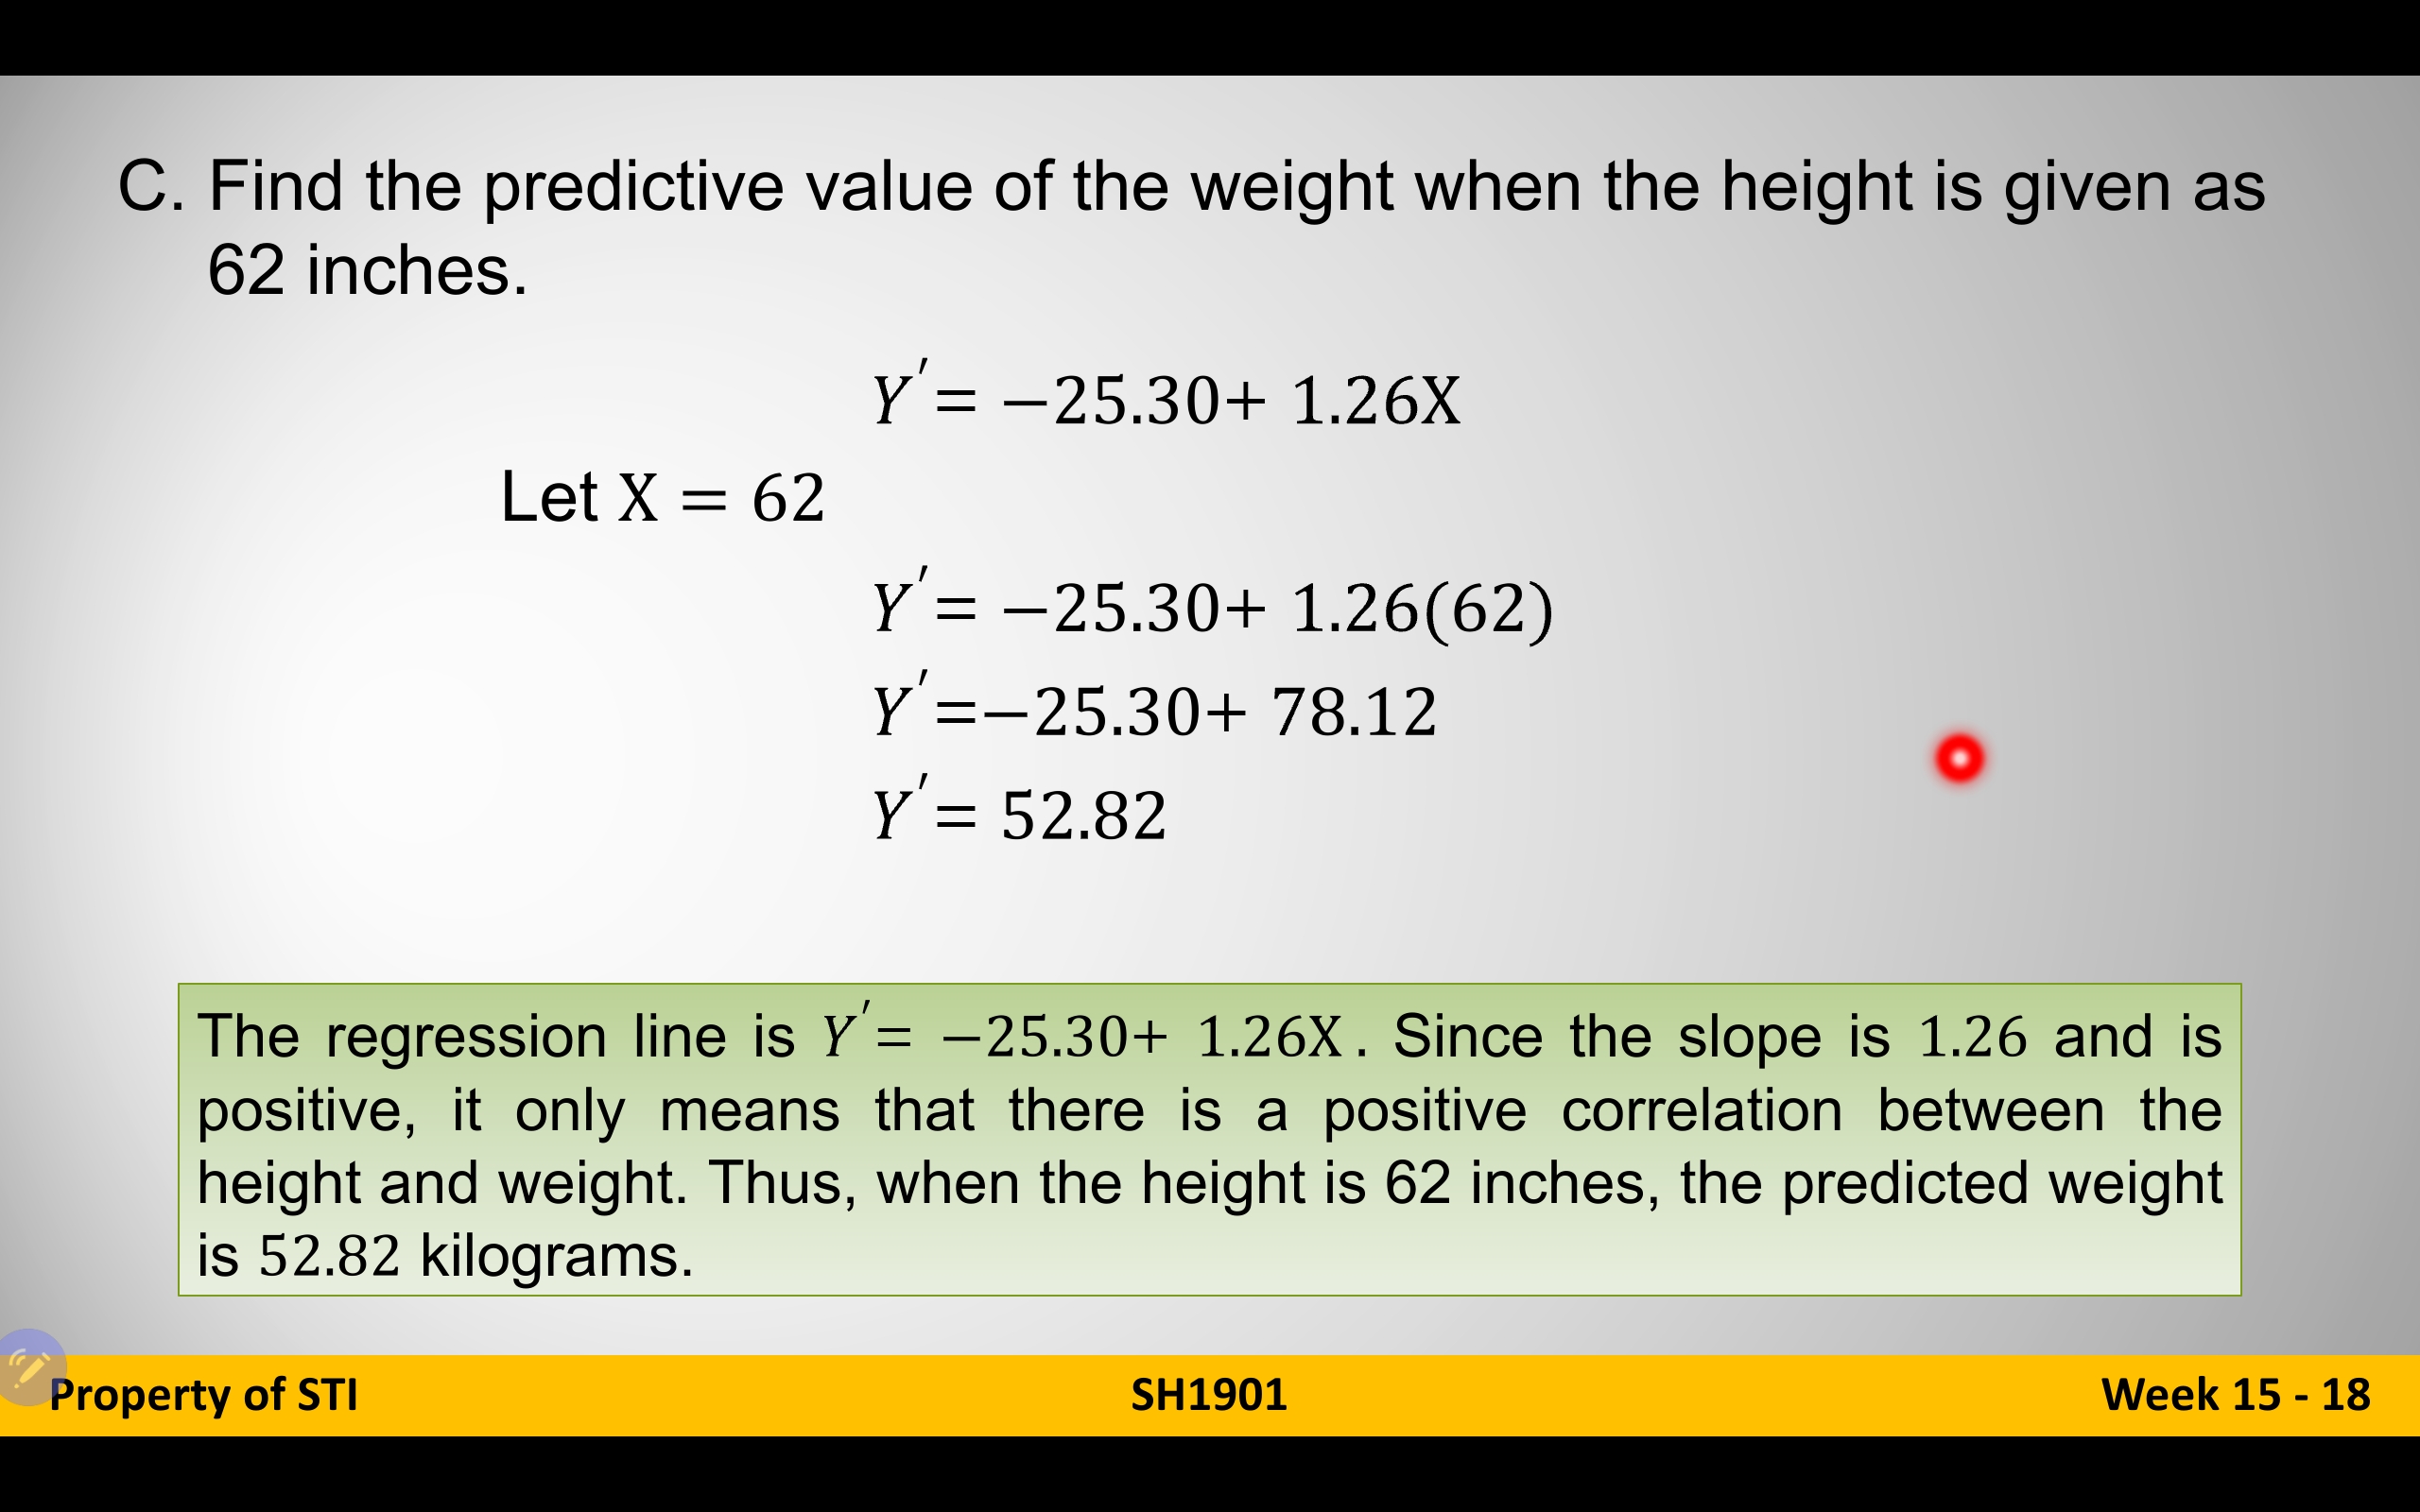
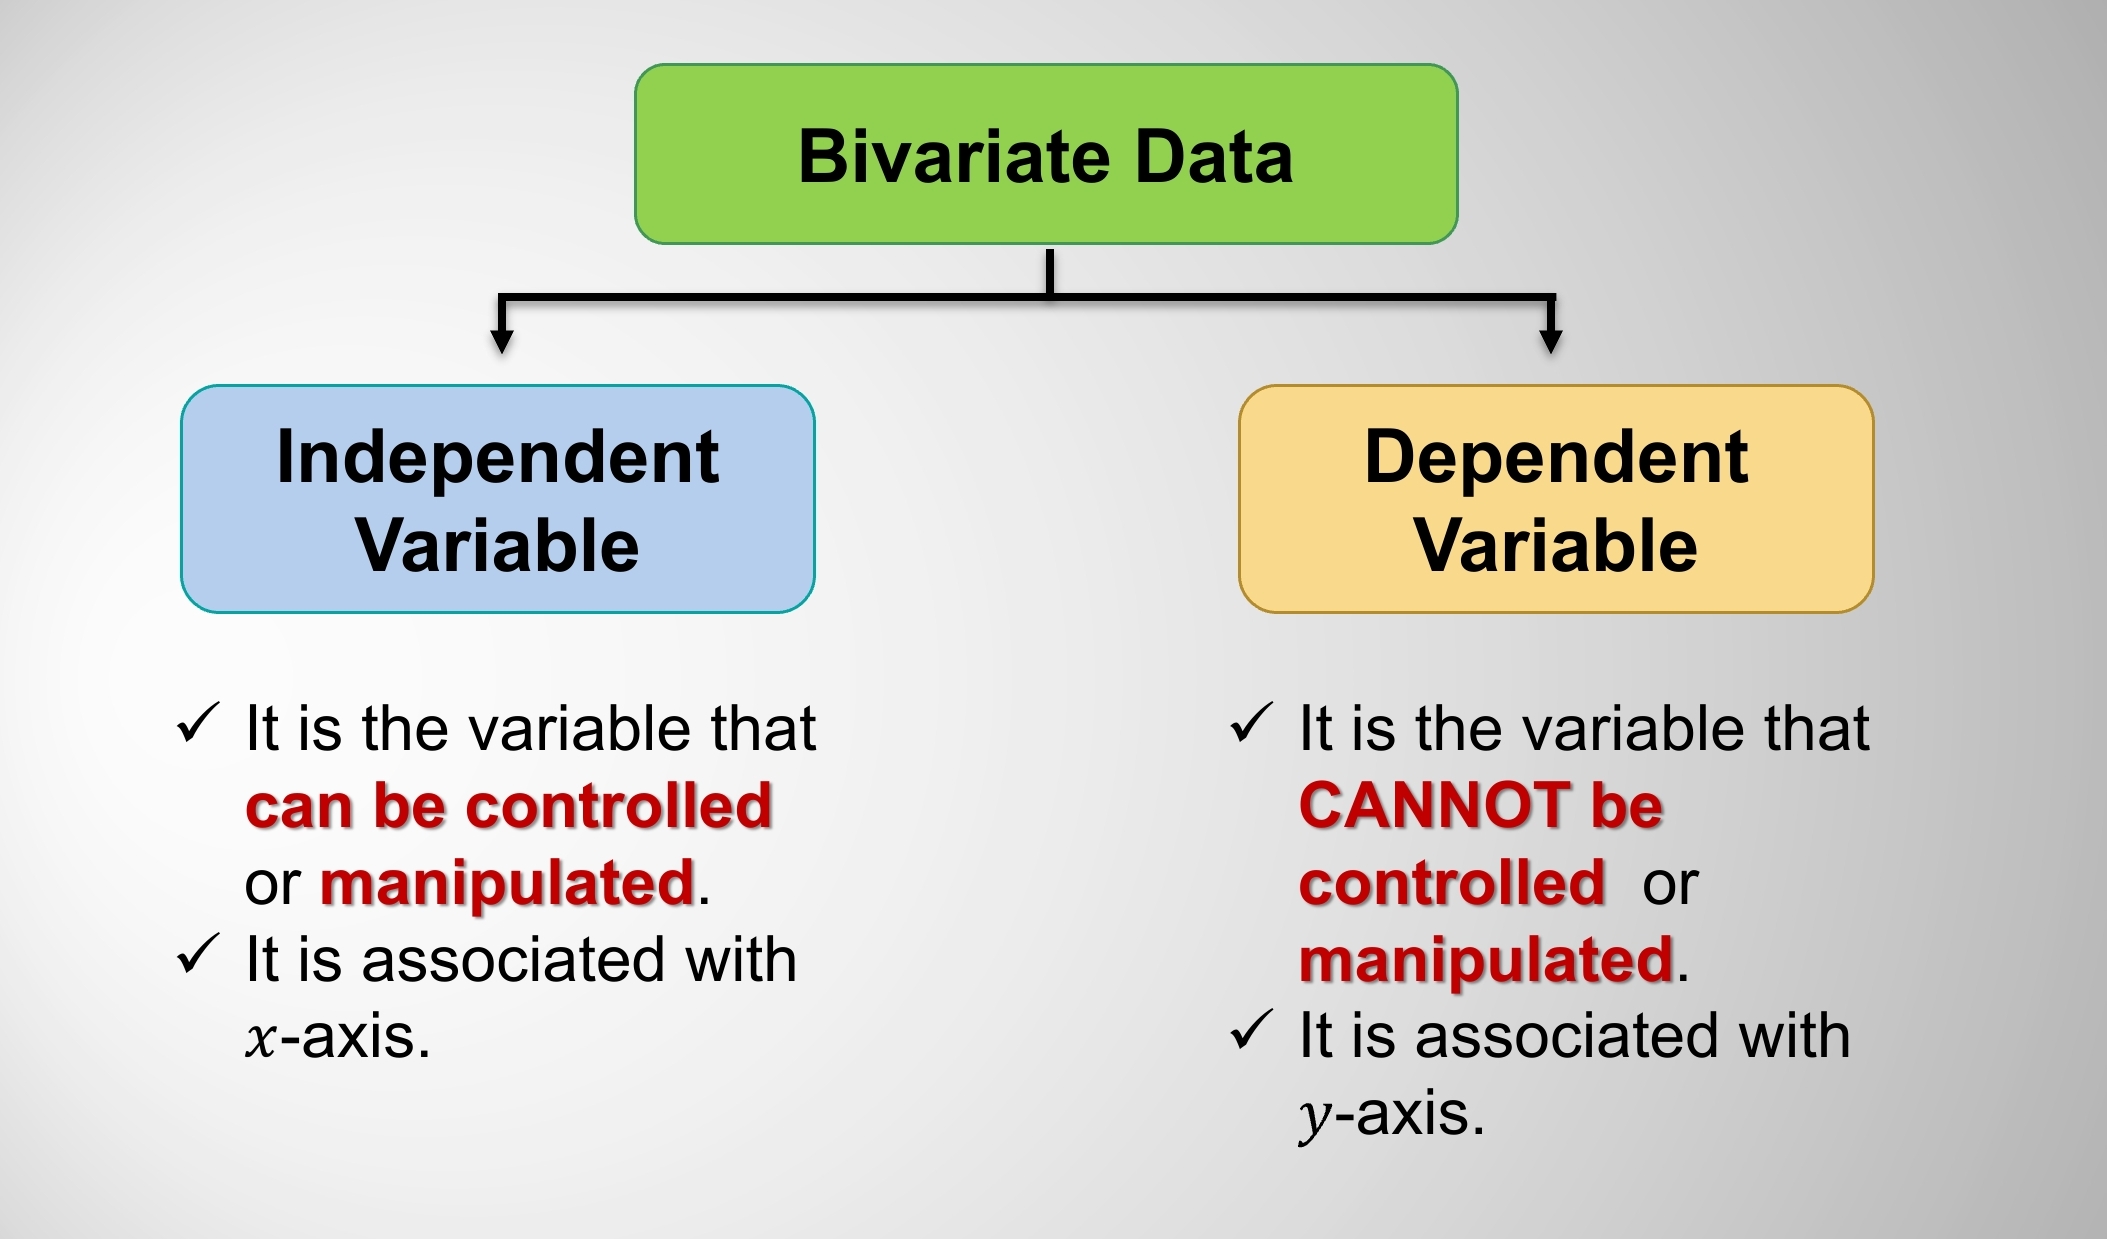
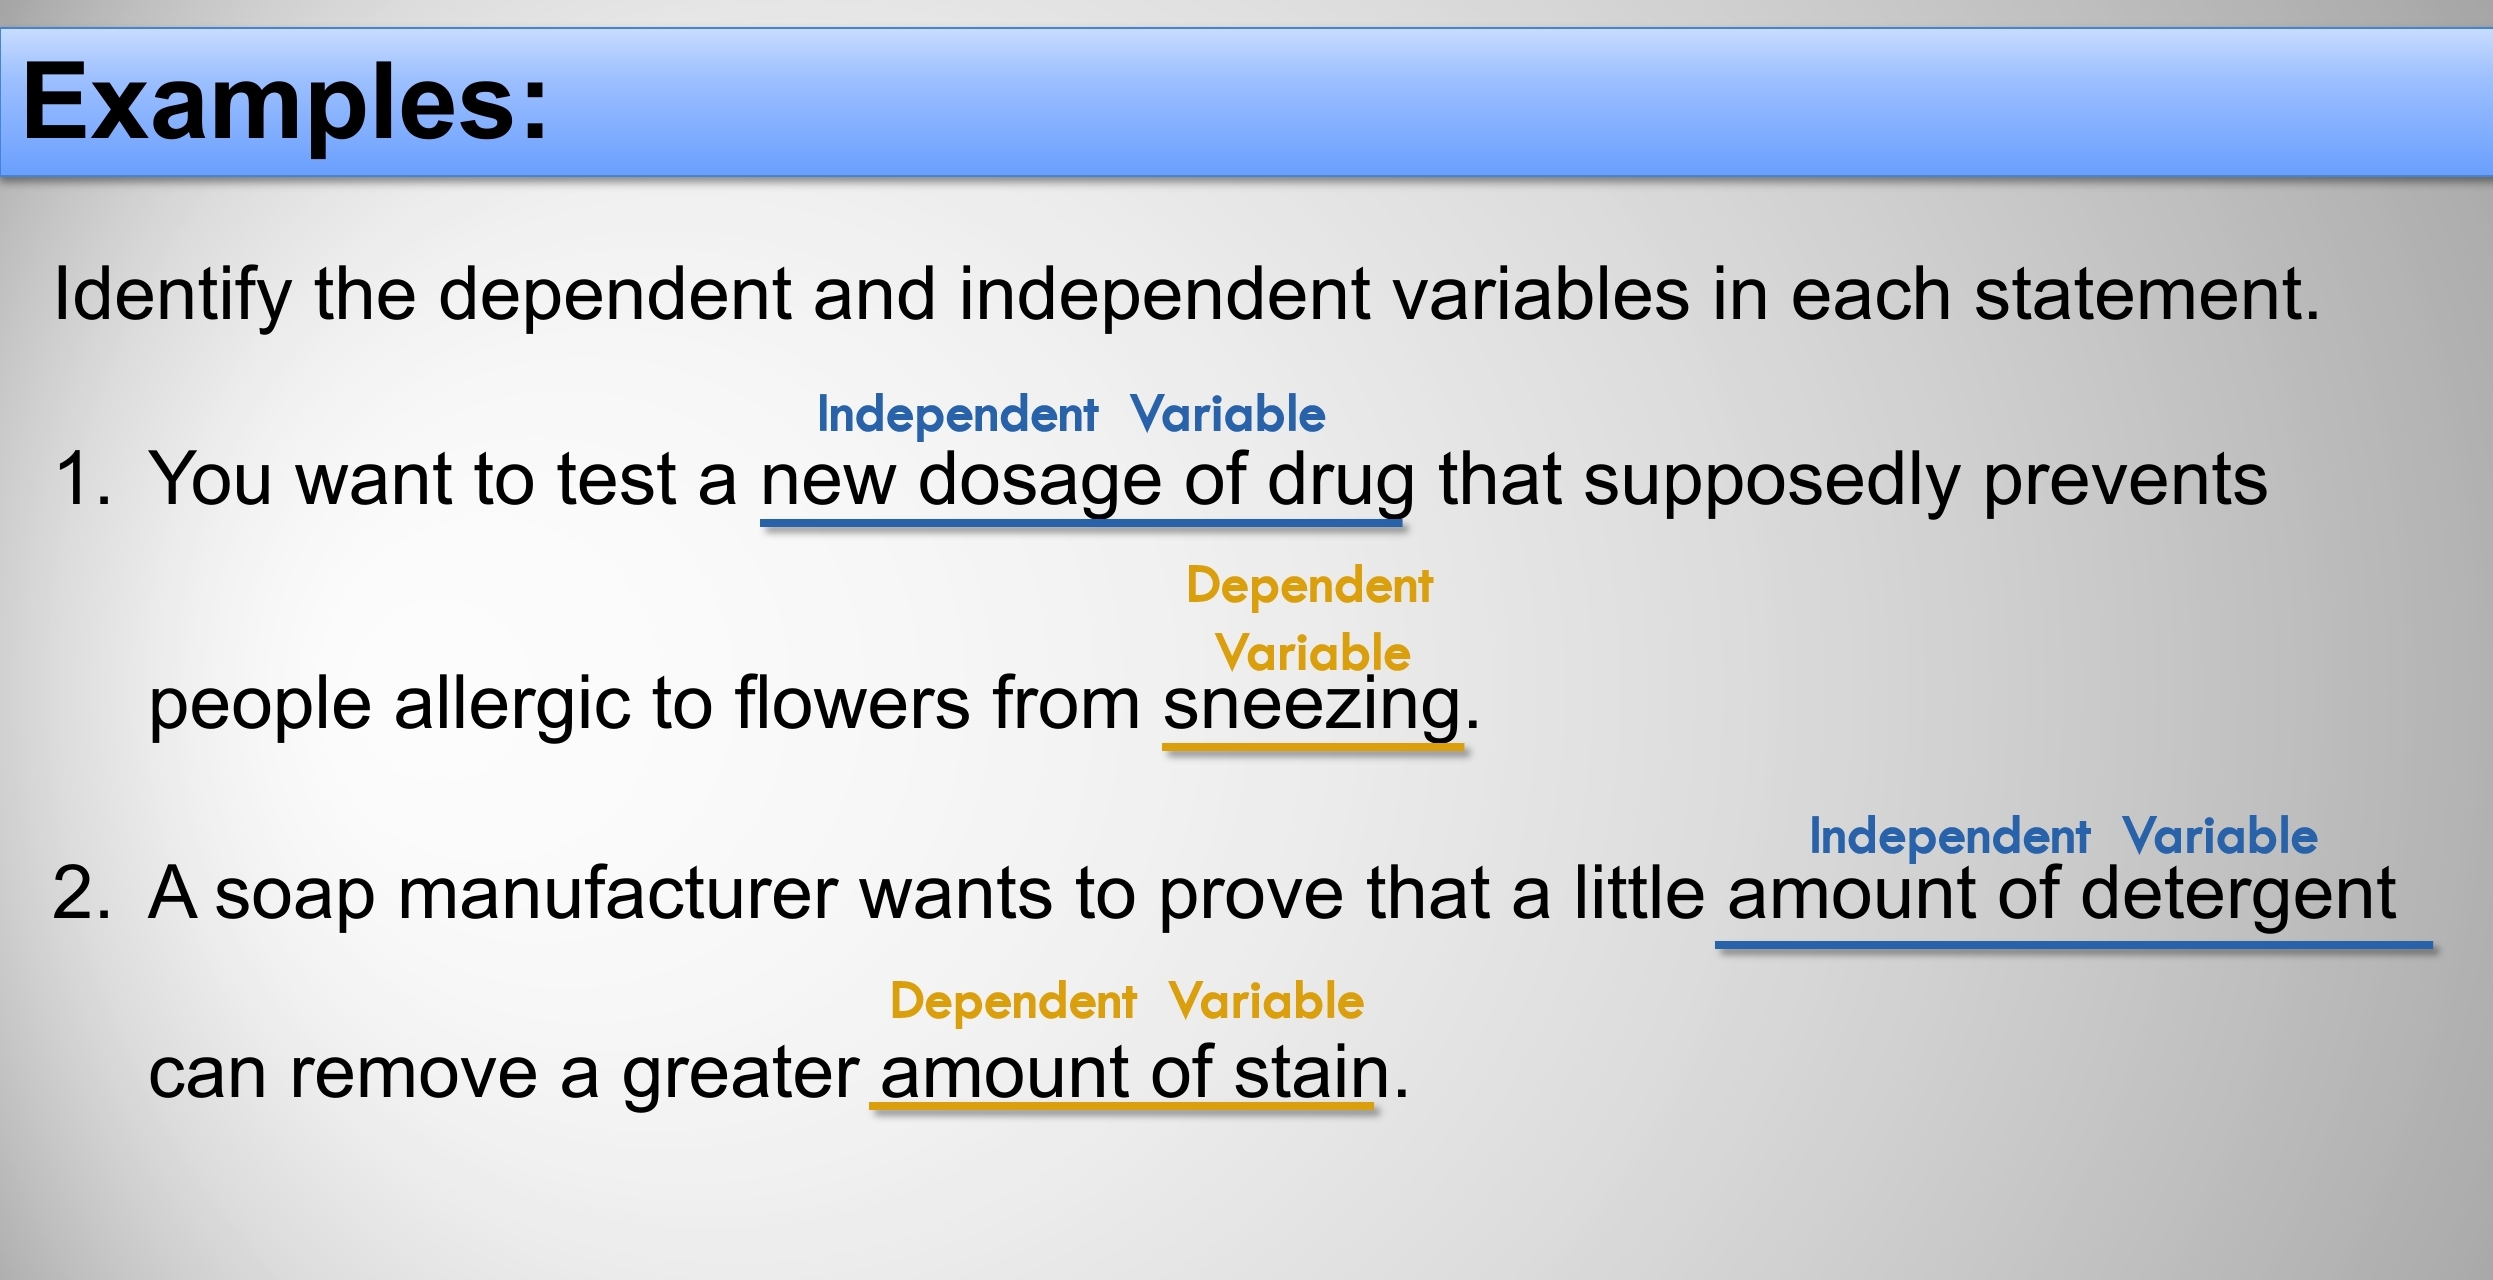
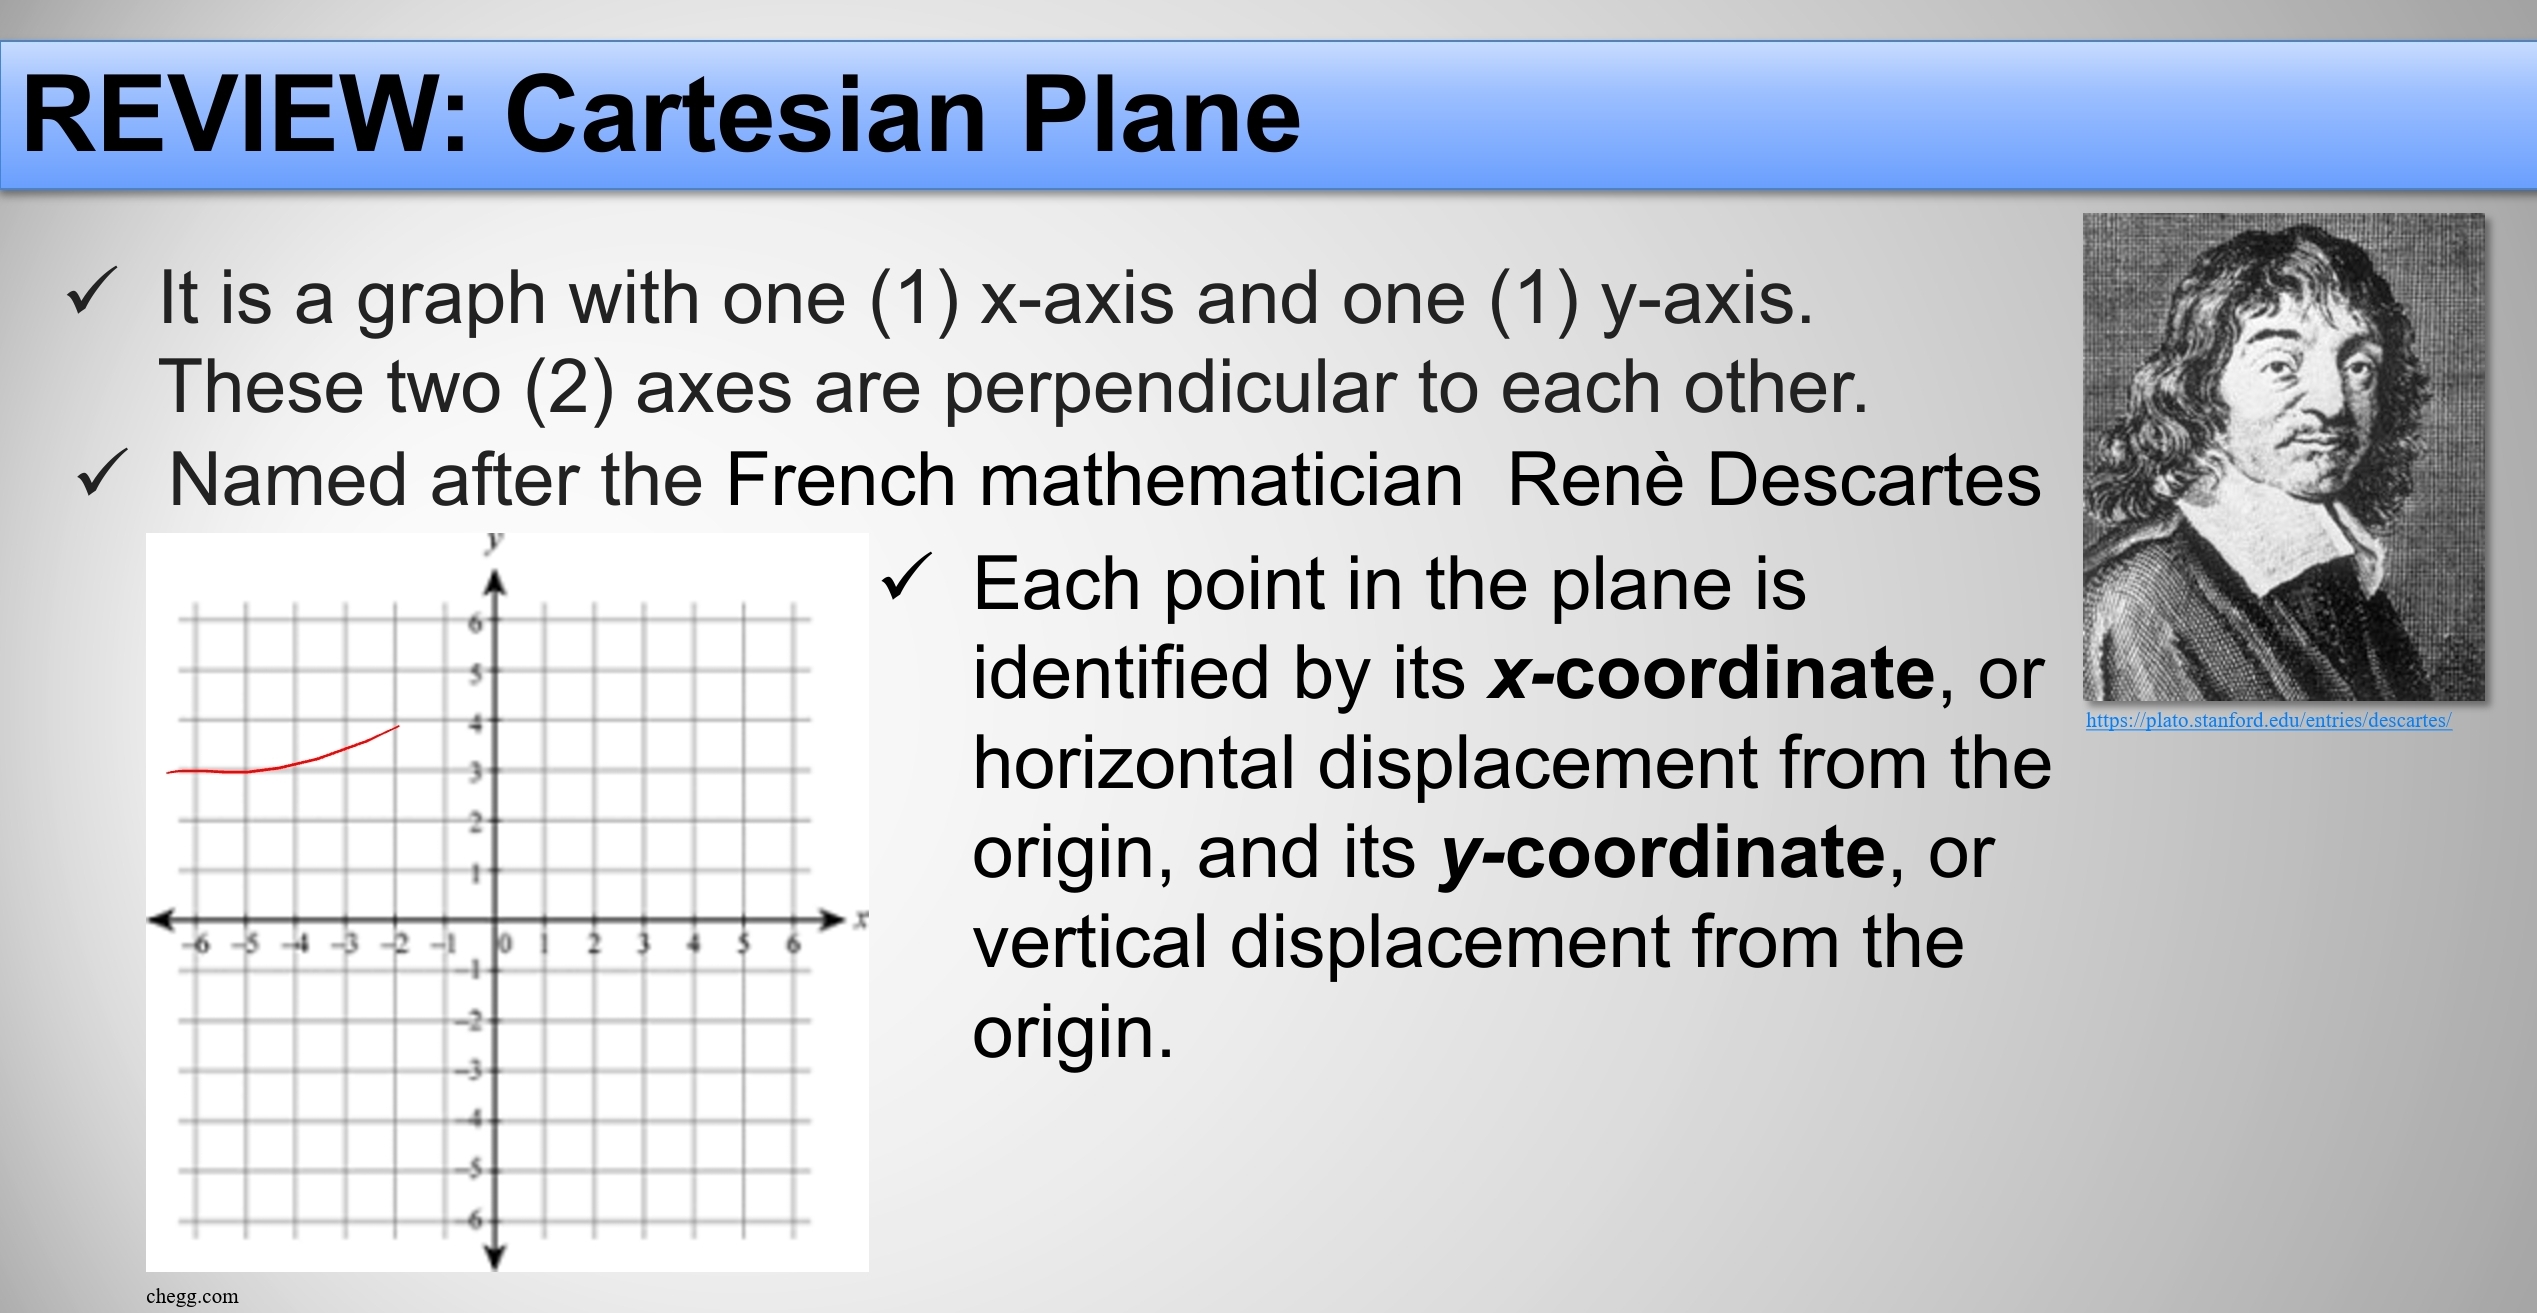
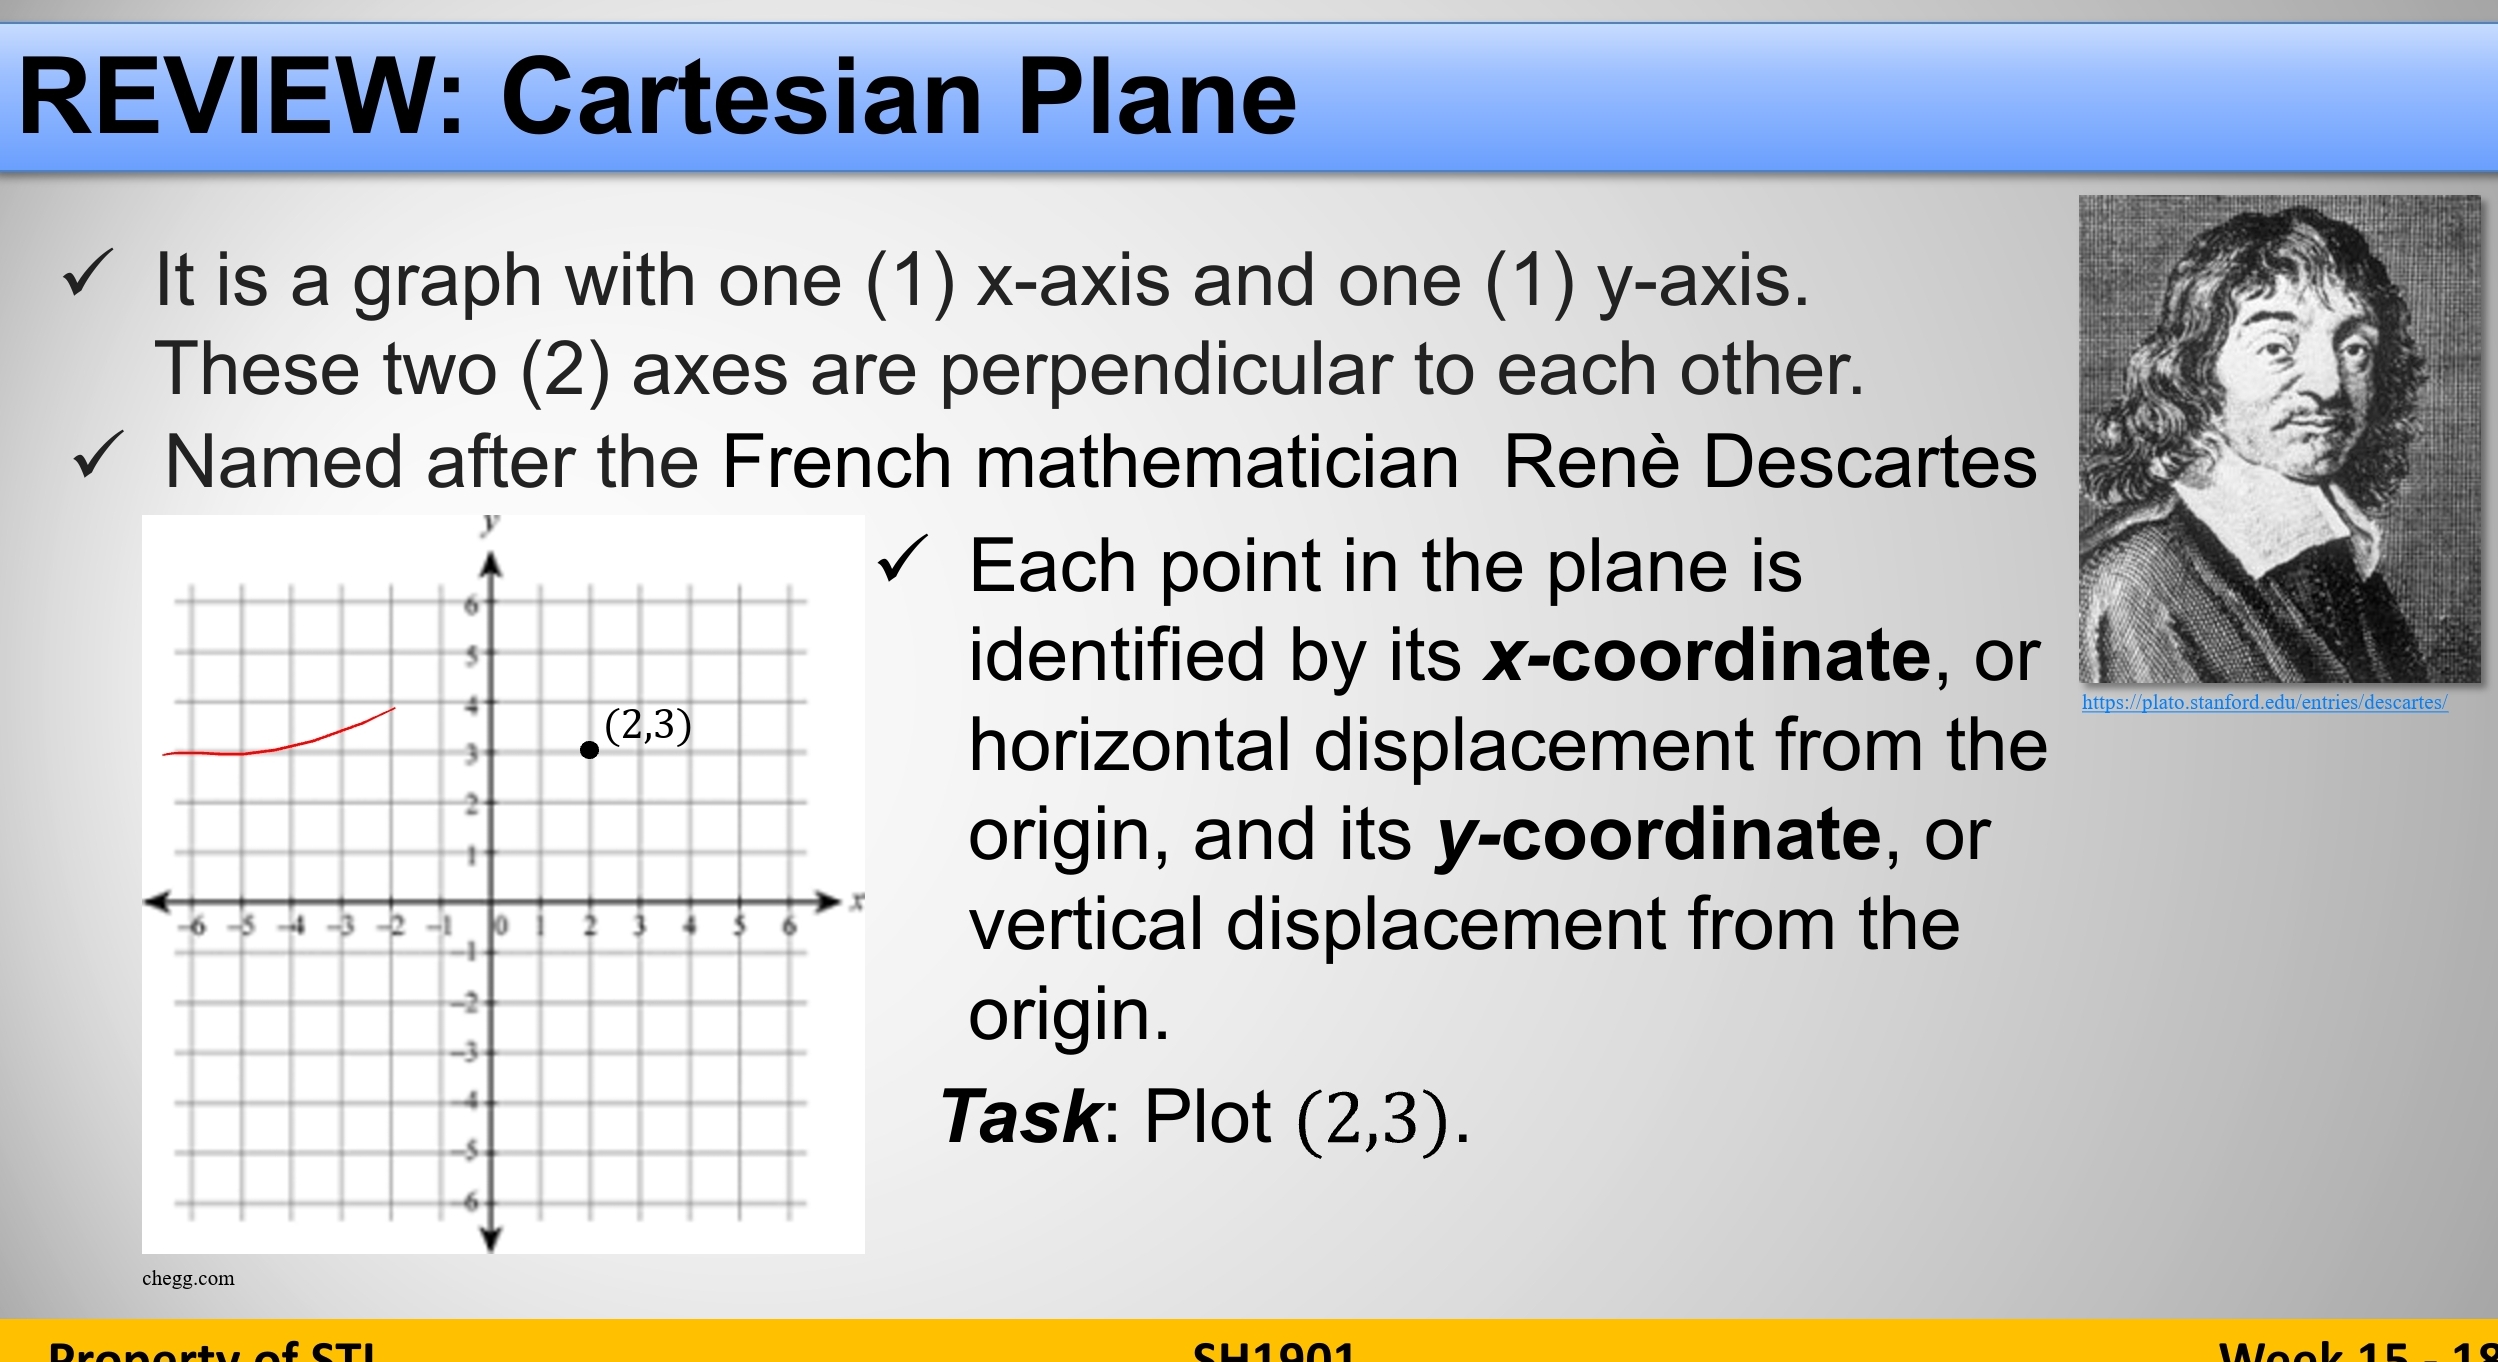
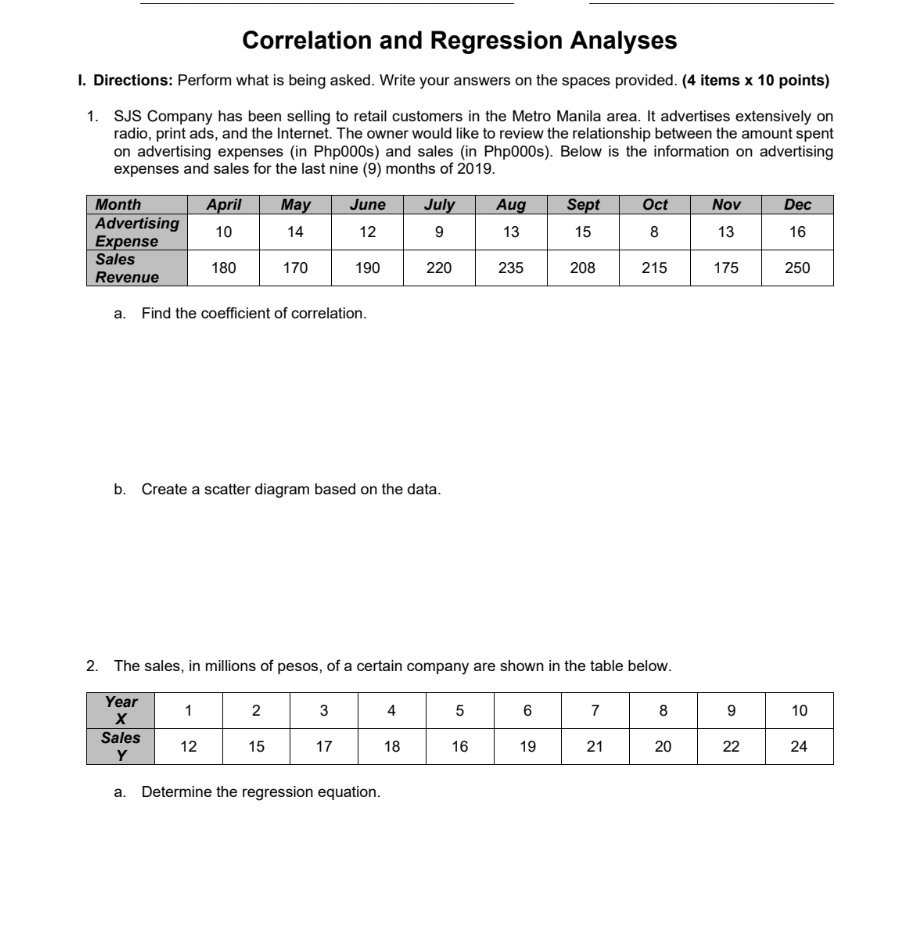
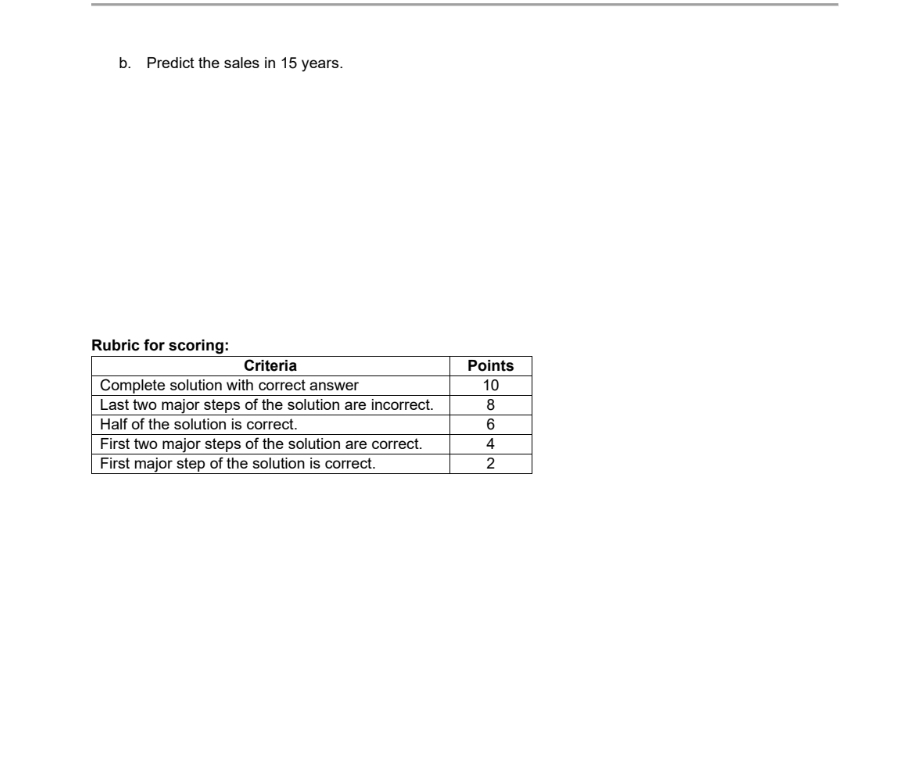
Patterns of Data in Scatter Diagram Linearity refers to whether a data pattern is linear (straight) or nonlinear (curved) 25 25 20 20 15 15 10 11 S 11 11 https://stattrek.com/statistics/charts/scatterplot.aspx Property of STI SH1901 Week 15 - 18Trn rl V refers to the direction of change in variable y ' gets bigger / If variable y also gets bigger, the slope is posit variable y gets QnaIIer, the slope is negative. Patterns of Data in Scatter Diagram Strength It refers to the degree of "scatter" in the plot. If the dots are widely spread, the relationship between the variables is weak. If the dots are concentrated around a line, the relationship is strong. 25 25 O 20 20 15 15 S ? 11 https://stattrek.com/statistics/charts/scatterplot.aspx Property of STI SH1901 Week 15 - 18cribe the linearity, slope, and strength of the follo Linear, positive Linear, zero slope. weak slope, strong Patterns of Data in Scatter Diagram Describe the linearity, slope, and strength of the following scatter diagram. 25 - 25 25 20 - 20 20 15. 15 15 10 11 11 5 S 4 5 6 Nonlinear, Nonlinear, Nonlinear, positive slope, negative zero slope, weak slope, strong, weak with gap Home https://stattrek.com/statistics/charts/scatterplot.aspx Property of STI SH1901 Week 15 - 18Correlation Analysis Correlation refers to the Bivariate Data departure of two (2) random variables from Independent Dependent independence. Variable Variable Correlation Analysis is a Correlation statistical method used to Analysis determined whether a relationship between variable exist. Property of STI SH1901 Week 15 - 18\fCorrelation Analysis Types of Correlation Kendall Rank Correlation is a non-parametric test that measures the strength of dependence between two (2) variables. O Spearman Rank Correlation is a non-parametric test that measures the degree of association between two (2) variables. Pearson r correlation is widely used in statistics to measure the degree of the relationship between linear related variables. Property of STI SH1901 Week 15 - 18Correlation Analysis Purpose To discover whether there is a relationship between variables To find out the direction of the relationship whether it is positive, negative, or zero V To find the strength of the relationship between the two (2) variables Property of STI SH1901 Week 15 - 18Correlation Analysis Coefficient of Correlation Also known as Pearson Product- Moment Correlation or Pearson r Correlation Named after Karl Pearson Describes the strength of the relationship between two (2) sets of variables n(EXY) - (EX) (EY) r= V [nEX2 - (EX)2InEY2 - (EY) 2] Property of STI SH1901 Week 15 - 18L Summary of Correlation Coefficient and Strength of Relationship 0.00 no correlation, no relationship $0.01 - $0.20 very low correlation, almost negligible relatiglship $0.21 - $0.40 slight correlation, definite but small relationship $0.41 - $0.70 moderate correlation, substantial relationship $0.71 - $0.90 high correlation, marked relationship $0.91 - $0.99 very high correlation, very dependable relationship $1.00 perfect correlation, perfect relationship Correlation Analysis Example The following table shows data that describe the test scores of STI students in Mathematics in relation to their test scores in Physics. Compute the correlation coefficient of these two (2) variables. Student 1 2 3 4 5 6 7 8 Math Score O 64 90 56 85 93 95 73 78 X Physics Score 70 85 60 70 88 98 60 80 Y Property of STI SH1901 Week 15 - 18Student Math Physics XY X2 Y2 Number Score X Score Y 64 70 4480 4096 4900 90 85 7650 8100 7225 56 60 3360 3136 3600 85 70 5950 7225 4900 CO V O U A W N 93 88 8184 8649 7744 95 98 9310 9025 9604 73 60 4380 5329 3600 78 80 6240 6084 6400 SUM EX = 634 EY = 611 EXY = 49554 EX2 = 51644 EY2 = 47973 Property of STI SH1901 Week 15 - 18\fn (EXY) - (EX) (EY) r= [nEX2 - (EX)2][nEY2 - (EY) 2] 8(49554) - (634) (611) r= [8(51644) - (634)2][8(47973) - (611)2] 396432 - 387374 r= (413152 - 401956) (383784 - 373321) 9058 r= The value of r is 0.84 is between 0.71 to (11196) (10463) 0.90 in the table for interpretation of r. It indicates that there is a strong positive or r = 0.8368984409 or 0.84 high correlation between the Math scores and the Physics scores of the STI students. Property of STI SH1901 Week 15 - 18\fCorrelation Analysis Example Nestor and Heide traveled from Town A X Y to Town B. They traveled at a constant 240 rate of 40 kilometers per hour. The 200 distance between Town A and Town B is 160 280 kilometers. Heide decided to write NO UI A W N - on a piece of paper the distance they O 120 need to travel after one (1) hour, two (2) 80 hours, three (3) hours, and so on until 40 they reached Town B. Solve for Pearson O Product Correlation Coefficient. Property of STI SH1901 Week 15 - 18\fn (EXY) - (EX) (EY) r= InEX2 - (EX)2][ncy2 - (EY) 2] 7(2240) - (28) (840) r= [7(140) - (28)2][7(145600) - (840)2] 15680 - 23520 r= [980 - 784][1019200 - 705600 -7840 O r= V61465600 r=-1 The value r = -1 shows a perfect negative correlation between the two (2) variables. Home Property of STI SH1901 Week 15 - 18/ It is the technique used to develop the equati and make these predictions. / The straight line that best illustrates the trend or data points seem to follow is called the best-fit y = mx + b, where m is the slope of the line and The equation that describes how variable y is rela and an error term a is called a simple linear reg which is given by Y = 50 + 31X + 8, where Y 2 dependent variable X 2 independent variable ,Boand ,81 = parameters of the model a =random variable Regression Analysis The estimated simple linear regression equation is given by Y' = a + bx where a = y -intercept b = slope of the line The formulas for a and b are: (E Y) (EX2 ) - (EX) (EXY) a = O n(Ex2 ) - (EX)2 n (EXY ) - (EX) (EY) b = n ( EX' ) - (EX) 2 Property of STI SH1901 Week 15 - 18REVIEW: Graphing of a Linear Equation Example Locate the y-intercept on Graph the equation y = 2x + 2. the graph and plot the point. From this point, use the slope to find a second point and plot it. O V Draw the line that connects the two (2) points. 6 5 4 -3 -2 -1 0 2 3 . X Chegg.com Property of STI SH1901 Week 15 - 18The following table shows data that describe the test '1 students in Mathematics in relation to their test scores is the regression equation? What will be the Physics sc student scored 98 in Math? 64 90 56 85 93 95 73 7:. 7O 85 60 7O 88 98 60 80 \fweight (in kilograms) of a random same students in high school. 58 59 61 62 63 48 5O 47 54 55 A. Construct the scatter diagram. diagram. ind the predictive value of the weight when the r A. Construct the scatter diagram. 56 55 54 53 52 Weight 51 50 O 49 48 47 46 57 58 59 60 61 62 63 64 Height Property of STI SH1901 Week 15 - 18\fB. Determine the equation of regression and graph it on the scatter diagram. (E Y) (E X2 ) - (EX) (EXY) b = n ( EXY) - (EX) (EY) a = n (Ex2) - (EX)2 z (X ]) - (2x 3) 2 (254) (18379) - (303) (15414) 5(15414) - (303) (254) a= b = 5(18379) - (303)2 5(18379) - (303)2 4668266 - 4670442 77070 - 76962 a = b = 91895 - 91809 91895 -91809 2176 108 a = b = 86 86 a = -2530232558 or -25.30 b = 1.255813953 or 1.26 Y' = a+ bx Y' = - 25.30+ 1.26X Property of STI SH1901 Week 15 - 18\fd the predictive value of the weight - .2inches. Y'= 25.30+ 1.26X Let x = 62 Y'= 25.30+ 1.26(62) Y'=25.3o+ 78.12 Y'= 52.82 ' height and weight. Thus, when the height is 62 inches, the predicted weight is 52.82 kilograms. / Bivariate data is a data that has two , / These variables are changing and are find the relationships between them. \\/ It is the variable that can be controlled or manipulated. J It is associated with x-axis. Examples: Identify the dependent and independent variables in each statement. Independent Variable 1. You want to test a new dosage of drug that supposedly prevents Dependent Variable people allergic to flowers from sneezing. Independent Variable 2. A soap manufacturer wants to prove that a little amount of detergent Dependent Variable can remove a greater amount of stain.Bivariate Data and Scatter Diagram Scatter Diagram or Scatter Plot the most important graphical summary of a bivariate data shows association or trend between the independent and dependent variablesREVIEW: Cartesian Plane It is a graph with one (1) x-axis and one (1) y-axis. These two (2) axes are perpendicular to each other. Named after the French mathematician Rene Descartes Each point in the plane is identified by its x-coordinate, or https://plato.stanford.edu/entries/descartes/ horizontal displacement from the origin, and its y-coordinate, or -6 -5 -4 -3 2 -1023 vertical displacement from the origin. chegg.comREVIEW: Cartesian Plane It is a graph with one (1) x-axis and one (1) y-axis. These two (2) axes are perpendicular to each other. V Named after the French mathematician Rene Descartes Each point in the plane is identified by its x-coordinate, or https://plato.stanford.edu/entries/descartes/ (2,3) horizontal displacement from the origin, and its y-coordinate, or -6 -5 -4 -3 2 -1 0 1 2 3 vertical displacement from the origin. Task: Plot (2,3). chegg.com CTI CU10 1Correlation and Regression Analyses I. Directions: Perform what is being asked. Write your answers on the spaces provided. {4 Items x 10 points] 1. SJS Company has been selling to retail customers in the Metro Manila area. It advertises extensively on radio. print ads, and the Internet. The owner would like to review the relationship between the amount spent on advertising expenses (in PhpOlJOs) and sales (in PhpDOIDs). Below is the information on advertising expenses and sales for the last nine {9) months of 2019. \"In-mu -Wm a. Find the coeflicient of correlation. b. Create a scatter diagram based on the data. 2. The sales, in millions of pesos, of a certain company are shaWn in the table below. 3. Determine the I'BQFEBSIDH equation. b. Predict the sales in 15 years. Rubric for scoring: CHM\"! Complete solution with correct answer .E- Last two me or steps of the solution are Incorrect. \" _ Half of the solution Is correct First two ms or steps of the solution are correct. 4 First major step of the solution is correct. 2
Step by Step Solution
There are 3 Steps involved in it
Step: 1
Get Instant Access to Expert-Tailored Solutions
See step-by-step solutions with expert insights and AI powered tools for academic success
Step: 2
Step: 3
Ace Your Homework with AI
Get the answers you need in no time with our AI-driven, step-by-step assistance