Kindly read the question and answer all parts of the read it thorughly and then start solving. I need your help. i ll upvote your efforts

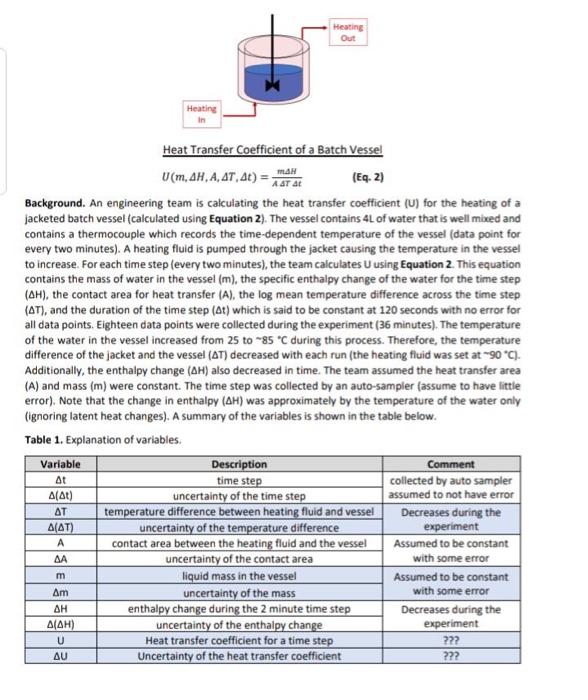
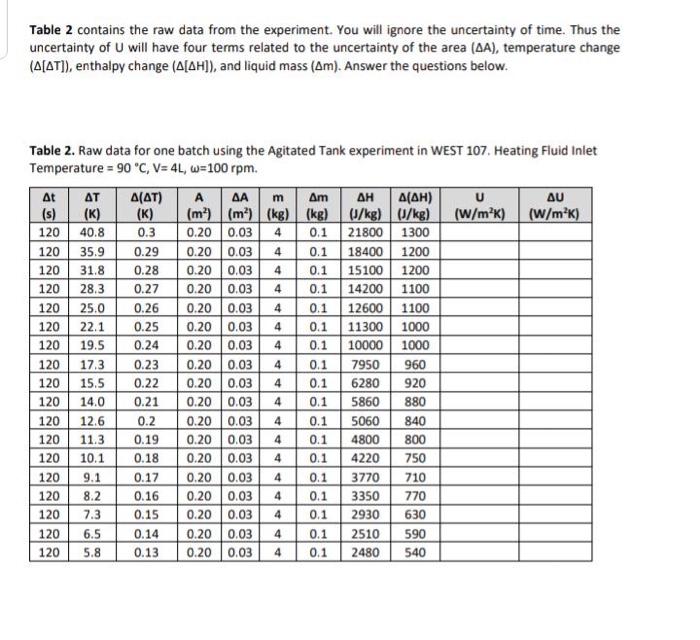
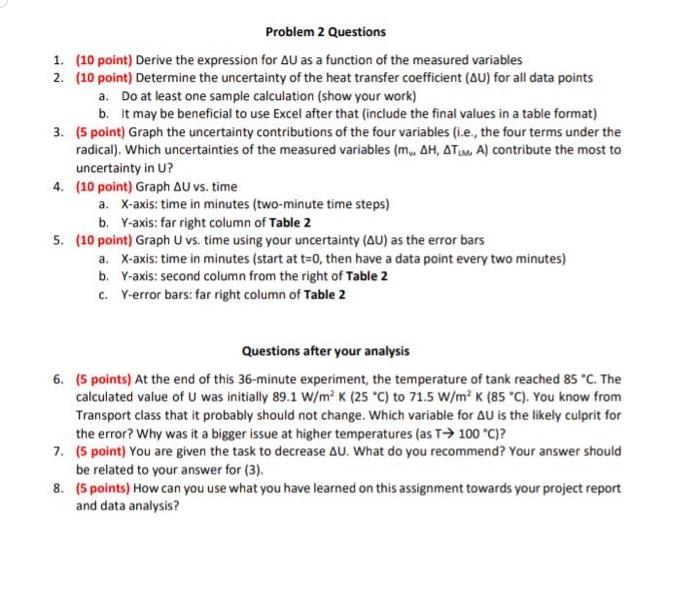
Background. An engineering team is calculating the heat transfer coefficient (U) for the heating of a jacketed batch vessel (calculated using Equation 2). The vessel contains 4L of water that is well mixed and contains a thermocouple which records the time-dependent temperature of the vessel (data point for every two minutes). A heating fluid is pumped through the jacket causing the temperature in the vessel to increase. For each time step (every two minutes), the team calculates U using Equation 2. This equation contains the mass of water in the vessel (m), the specific enthalpy change of the water for the time step (H), the contact area for heat transfer (A), the log mean temperature difference across the time step (T), and the duration of the time step ( t) which is said to be constant at 120 seconds with no error for all data points. Eighteen data points were collected during the experiment ( 36 minutes). The temperature of the water in the vessel increased from 25 to 85C during this process. Therefore, the temperature difference of the jacket and the vessel ( T T) decreased with each run (the heating fluid was set at 90C ). Additionally, the enthalpy change (H) also decreased in time. The team assumed the heat transfer area (A) and mass ( m ) were constant. The time step was collected by an auto-sampler (assume to have little error). Note that the change in enthalpy (H) was approximately by the temperature of the water only (ignoring latent heat changes). A summary of the variables is shown in the table below. Table 1. Explanation of variables. Table 2 contains the raw data from the experiment. You will ignore the uncertainty of time. Thus the uncertainty of U will have four terms related to the uncertainty of the area (A), temperature change ([T]), enthalpy change ([H]), and liquid mass ( m). Answer the questions below. Table 2. Raw data for one batch using the Agitated Tank experiment in WEST 107. Heating Fluid Inlet Temperature =90C,V=4L,=100rpm. 2. (10 point) Determine the uncertainty of the heat transfer coefficient (U) for all data points a. Do at least one sample calculation (show your work) b. It may be beneficial to use Excel after that (include the final values in a table format) 3. (5 point) Graph the uncertainty contributions of the four variables (i.e., the four terms under the radical). Which uncertainties of the measured variables (mv,H,TLM,A) contribute the most to uncertainty in U? 4. (10 point) Graph U vs. time a. X-axis: time in minutes (two-minute time steps) b. Y-axis: far right column of Table 2 5. (10 point) Graph U vs, time using your uncertainty (U) as the error bars a. X-axis: time in minutes (start at t=0, then have a data point every two minutes) b. Y-axis: second column from the right of Table 2 c. Y-error bars: far right column of Table 2 Questions after your analysis 6. (5 points) At the end of this 36-minute experiment, the temperature of tank reached 85C. The calculated value of U was initially 89.1W/m2K(25C) to 71.5W/m2K(85C). You know from Transport class that it probably should not change. Which variable for U is the likely culprit for the error? Why was it a bigger issue at higher temperatures ( as T100C) ? 7. (5 point) You are given the task to decrease U. What do you recommend? Your answer should be related to your answer for (3). 8. (5 points) How can you use what you have learned on this assignment towards your project report and data analysis


