Kindly solve the following questions.
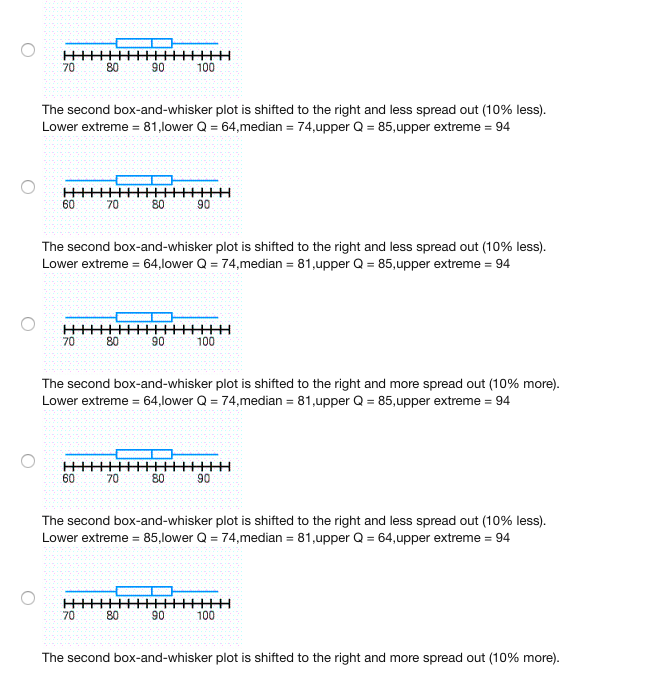
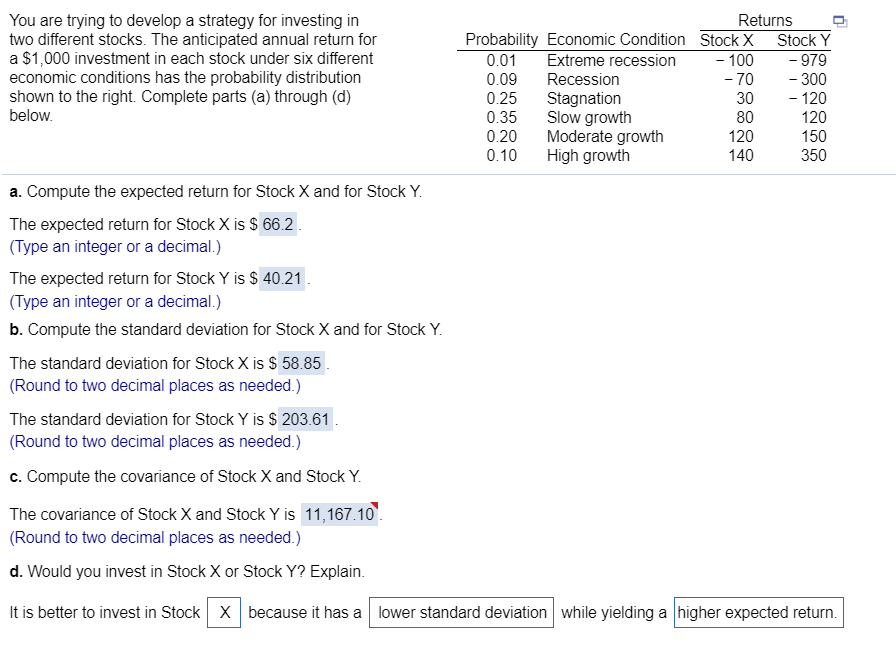
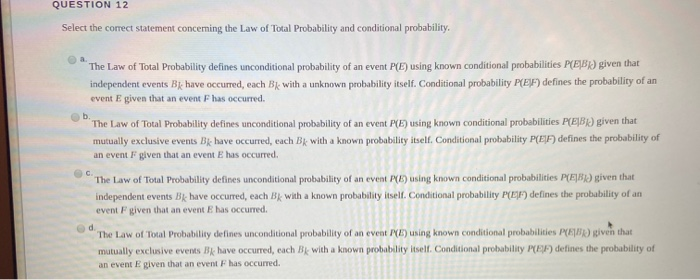
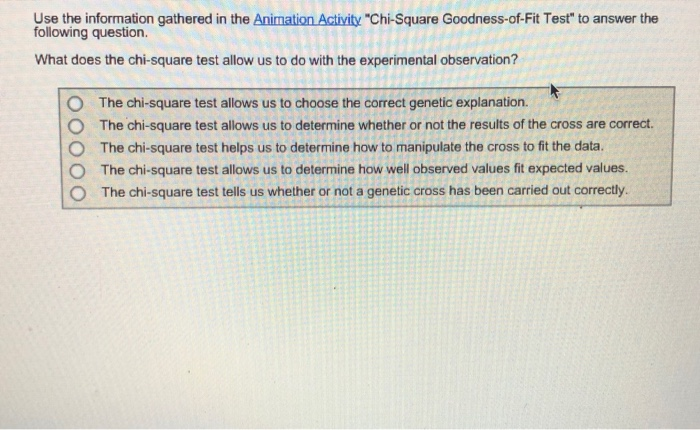
O 70 80 90 100 The second box-and-whisker plot is shifted to the right and less spread out (10% less). Lower extreme = 81, lower Q = 64,median = 74,upper Q = 85, upper extreme = 94 O 60 70 80 90 The second box-and-whisker plot is shifted to the right and less spread out (10% less). Lower extreme = 64,lower Q = 74,median = 81,upper Q = 85, upper extreme = 94 O 80 90 100 The second box-and-whisker plot is shifted to the right and more spread out (10% more). Lower extreme = 64,lower Q = 74,median = 81,upper Q = 85, upper extreme = 94 O 60 70 90 The second box-and-whisker plot is shifted to the right and less spread out (10% less). Lower extreme = 85,lower Q = 74,median = 81,upper Q = 64,upper extreme = 94 O 70 90 100 The second box-and-whisker plot is shifted to the right and more spread out (10% more).You are trying to develop a strategy for investing in two different stocks. The anticipated annual retum for a $1 r000 investment in each stock under six different economic conditions has the probability distnbution shown to the light. Complete parts (a) through ((1) below. a. Compute the expected return for Stock X and for Stock '1'. The expected return for Stock X is $ 56.2 . (Type an integer or a decimal} The expected return for Stock Y is $ 40.21 . (Type an integer or a decimal} b. Compute the standard deviation for Stock X and for Stock Y. The standard deviation for Stock X is $ 58.85 . (Round to two decimal places as needed.) The standard deviation for Stock Y is $ 203.61 . {Round to two decimal places as needed.) c. Compute the covariance of Stock X and Stock Y. The covariance of Stock X and Stock Y is 11 ,16110'. (Round to two decimal places as needed.) d. Would you invest in Stock X or Stock Y? Explain. Returns Probability Economic Condition Stock X Stock '1' 0.01 Extreme recession 100 0T9 0.09 Recession T0 300 0.25 Stagnation 30 120 0.35 Slow growth 80 120 0.20 Moderate growth 120 150 0.10 High growth 140 350 D. It is better to invest in Stock because it has a lower standard deviation while yielding a higher expected return. QUESTION 12 Select the comect statement concerning the Law of Total Probability and conditional probability. The Law of Total Probability defines unconditional probability of an event P(E) using known conditional probabilities P(BB) given that independent events Bk have occurred, each Bk with a unknown probability itself. Conditional probability P(E F) defines the probability of an event E given that an event F has occurred. Ob. The Law of Total Probability defines unconditional probability of an event P(E) using known conditional probabilities P(E B) given that mutually exclusive events B& have occurred, each BA with a known probability itself. Conditional probability P(E) ) defines the probability of an event F given that an event E has occurred. The Law of Total Probability defines unconditional probability of an event P(E) using known conditional probabilities P(E)By) given that independent events BA have occurred, each BK with a known probability itself. Conditional probability P(E F) defines the probability of an event F given that an event E has occurred. The Law of Total Probability defines unconditional probability of an event P(2) using known conditional probabilities P(FB) given that mutually exclusive events By have occurred, each By with a known probability itself. Conditional probability P(EA) defines the probability of an event E given that an event F has occurred.Use the information gathered in the Animation Activity "Chi-Square Goodness-of-Fit Test" to answer the following question. What does the chi-square test allow us to do with the experimental observation? O The chi-square test allows us to choose the correct genetic explanation. The chi-square test allows us to determine whether or not the results of the cross are correct. The chi-square test helps us to determine how to manipulate the cross to fit the data. ooo The chi-square test allows us to determine how well observed values fit expected values. The chi-square test tells us whether or not a genetic cross has been carried out correctlyThe Chi-squared test has been used earlier to test a hypothesis about a population variance. It is also a hypothesis testing procedure for when one or more variables in the research are categorical (nominal). During this week, we are covering the following two such Chi-squared tests: . Chi-squared Goodness of Fit Test . Chi-squared Test for Independency Describe why the Chi-squared tests of the types mentioned above are always right-tailed hypothesis testing problems