Kindly solve the question
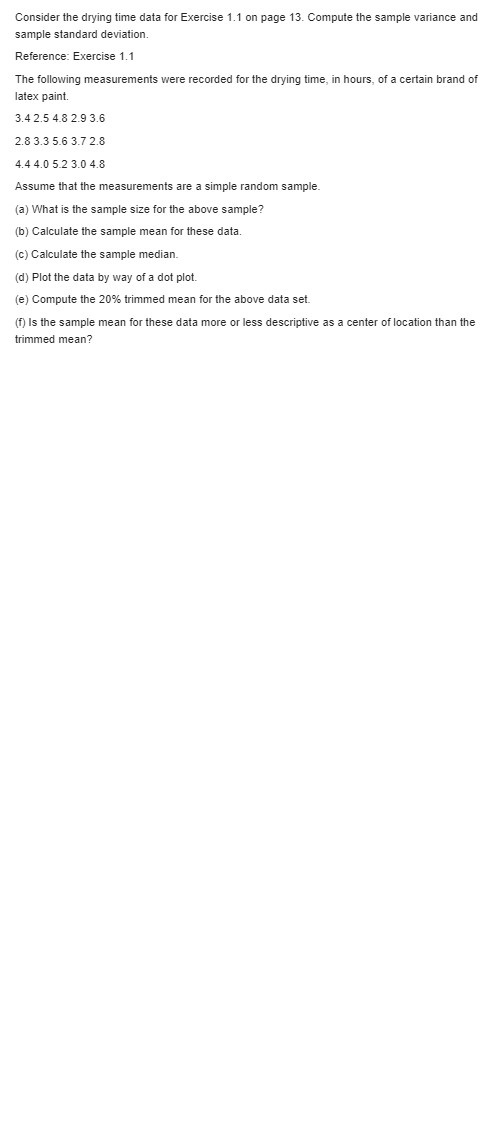
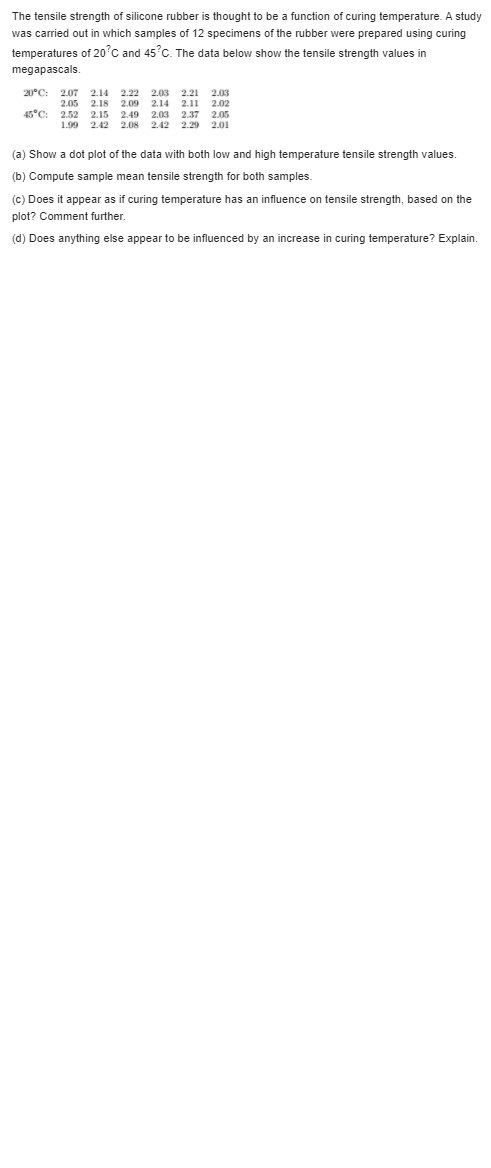
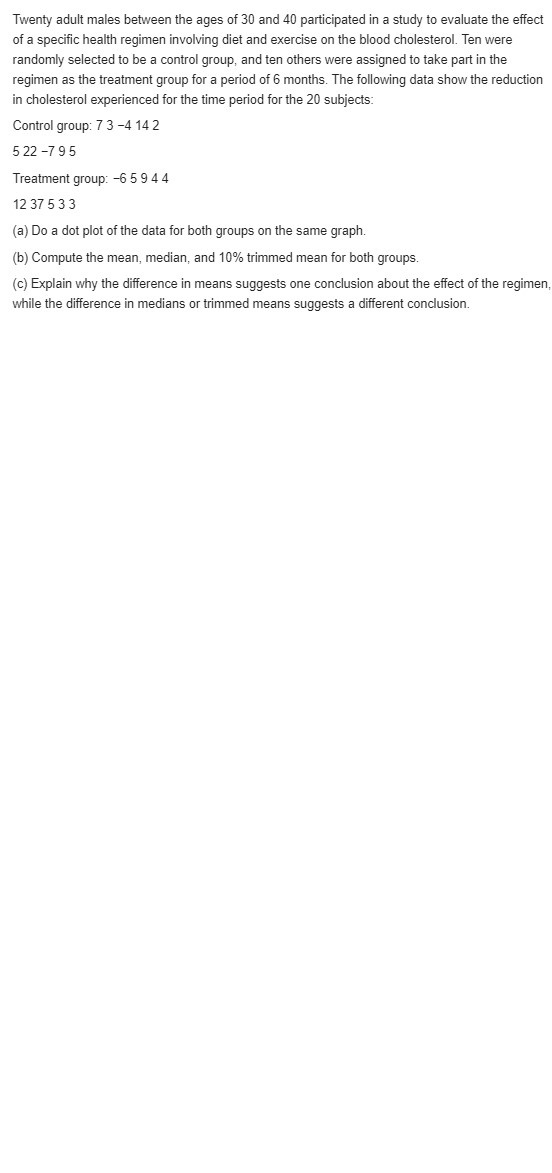
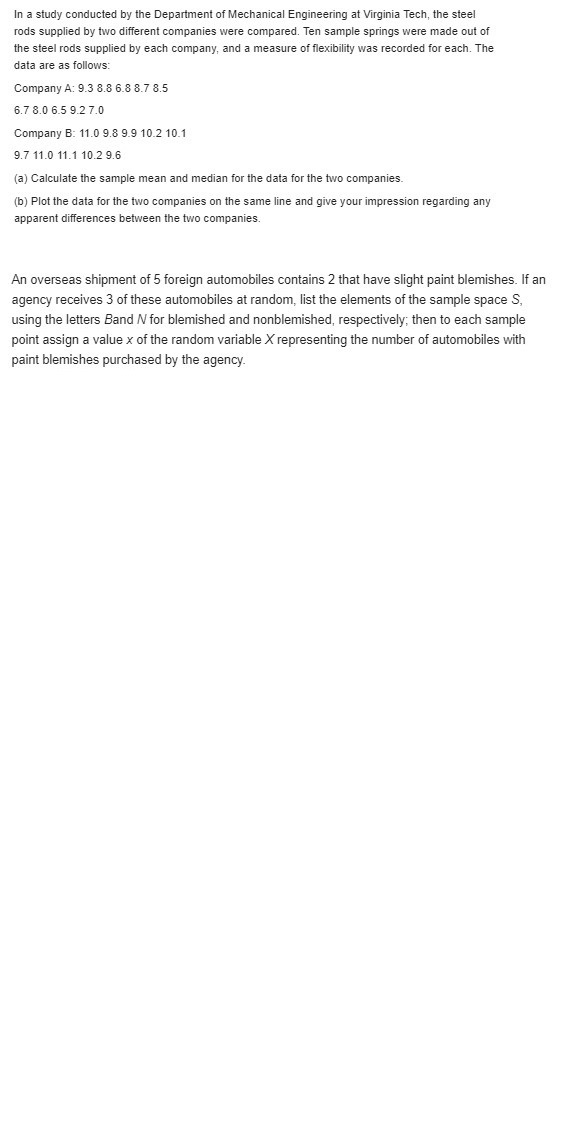
Consider the drying time data for Exercise 1.1 on page 13. Compute the sample variance and sample standard deviation. Reference: Exercise 1.1 The following measurements were recorded for the drying tine. in hours. of a certain brand of latex pa'nt. 3.4 2.5 4.8 2.9 3.6 2.8 3.3 5.5 3.? 2.3 4.4 4.0 5.2 3.0 4.3 Assume that the measurements are a simple random sample. {a} What is the sample size for the above sample? {In} Calculate the sample mean for these data. {c} Calculate the sample median. {djl Plot the data by way of a dot plot. {e} Compute the 20% trirm'ned mean for the above data set. { Is the sample mean for these data more or less descriptive as a center of location than the trimmed mean? The tensile strength of silicone rubber is thought to be a function of curing temperature. A study was carried out in which samples of 12 specimens of the rubber were prepared using curing temperatures of 20 C and 45 C. The data below show the tensile strength values in megapascals. 20 C: 2.07 2.14 2.22 2.03 2.21 2.03 2.05 2.18 2.09 2.14 2.11 2.02 45"C: 2.52 2.15 2.49 2.03 2.37 2.05 1.99 2.42 2.08 2.42 2.29 2.01 (a) Show a dot plot of the data with both low and high temperature tensile strength values. (b) Compute sample mean tensile strength for both samples. (c) Does it appear as if curing temperature has an influence on tensile strength, based on the plot? Comment further. (d) Does anything else appear to be influenced by an increase in curing temperature? Explain.Twenty adult males between the ages of 30 and 40 participated in a study to evaluate the effect of a specific health regimen involving diet and exercise on the blood cholesterol. Ten were randomly selected to be a control group, and ten others were assigned to take part in the regimen as the treatment group for a period of 6 months. The following data show the reduction in cholesterol experienced for the time period for the 20 subjects: Control group: 7 3 -4 14 2 522 -795 Treatment group: -6 5 9 4 4 12 37 5 3 3 (a) Do a dot plot of the data for both groups on the same graph. (b) Compute the mean, median, and 10% trimmed mean for both groups. (c) Explain why the difference in means suggests one conclusion about the effect of the regimen while the difference in medians or trimmed means suggests a different conclusion.In a study conducted by the Department of Mechanical Engineering at Virginia Tech, the steel rods supplied by two different companies were compared. Ten sample springs were made out of the steel rods supplied by each company, and a measure of flexibility was recorded for each. The data are as follows: Company A: 9.3 8.8 6.8 8.7 8.5 6.7 8.0 6.5 9.2 7.0 Company B: 11.0 9.8 9.9 10.2 10.1 9.7 11.0 11.1 10.2 9.6 (a) Calculate the sample mean and median for the data for the two companies. (b) Plot the data for the two companies on the same line and give your impression regarding any apparent differences between the two companies. An overseas shipment of 5 foreign automobiles contains 2 that have slight paint blemishes. If an agency receives 3 of these automobiles at random, list the elements of the sample space S, using the letters Band / for blemished and nonblemished, respectively; then to each sample point assign a value x of the random variable X representing the number of automobiles with paint blemishes purchased by the agency


