

Question
Kindly solve the questions in the above image by using excel to show the formula that should be in each of the cells below (Mind
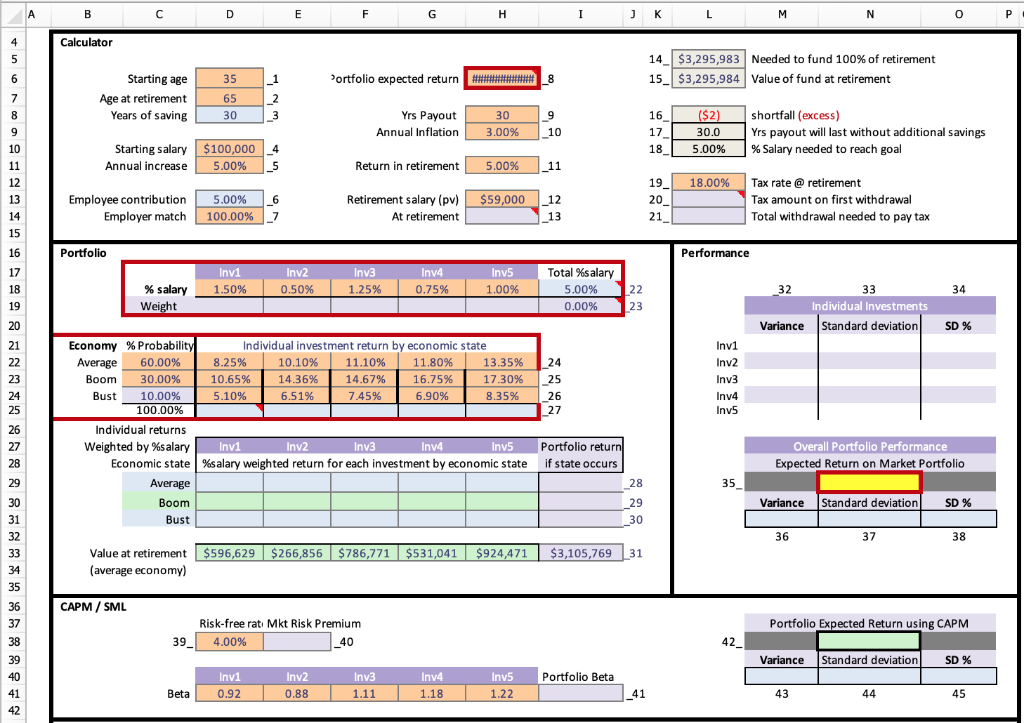
Kindly solve the questions in the above image by using excel to show the formula that should be in each of the cells below (Mind you, the cells that require information are the cells that you see a number beside each, and that corresponds to the numbering of the cell questions below:
(I want each formula to be shown on the excel sheet clearly so I can replicate it where needed).
Cell 13: Insert the formula to calculate the FV or your retirement salary adjusted for inflation
Cell 20: Insert the formula to calculate the tax amount on the first withdrawal
Cell 21: Insert the formula to calculate the total amount needed to pay the tax + tax on tax withdrawal
Cell 23: Insert the formulas in cells D19 to H19 to calculate the weighting % of the employee contribution for each investment, cell-I19 should always be 100%
Cell 27: Insert the formulas to calculate the expected market return for each individual investment, as if it were the only one.
Cell 28: insert formulas in cells D29 to H29 to calculate the weighted (%salary) return of each investment in an average economy
Cell 29: Insert formulas in cells D30 to H30 to calculate the weighted return of each investment in an Boom economy,
Cell 30: insert formulas in cells D31 to H31 to calculate the weighted (%salary) return of each investment in an Bust economy,
Cell 31: Input the link in cells D33 to H33 to report the value at retirement of each investment for an average economy,
Cell 32: Insert the formula in cells M20 to M24 to calculate the variance of each individual investment
Cell 33: Insert the formulas in cells M20 to M24to calculate the standard deviation of the portfolio as a decimal number
Cell 34: Display the standard deviation for each investment as a % in cells O20 to O24
Cell 36: Insert the formula in cell M31 to calculate the variance of the portfolio.
Cell 37: Insert the formula in cell N31 to calculate the portfolio standard deviation as a decimal number
Cell 38: Display the portfolio standard deviation as a percent
Cell 40: Insert the formula to calculate the 'risk premium' for the portfolio
Cell 41: Insert the formula to calculate the portfolio beta when given beta of individual investments
Cell 42: Insert the formula to calculate the portfolio expected return using the capital asset pricing model
Cell 43: Insert the formula to calculate the portfolio variance using the CAPM expected return
Cell 44: Insert the formula to calculate the standard deviation using the CAPM expected return
Cell 45: Display the standard deviation for the portfolio using the CAPM expected return
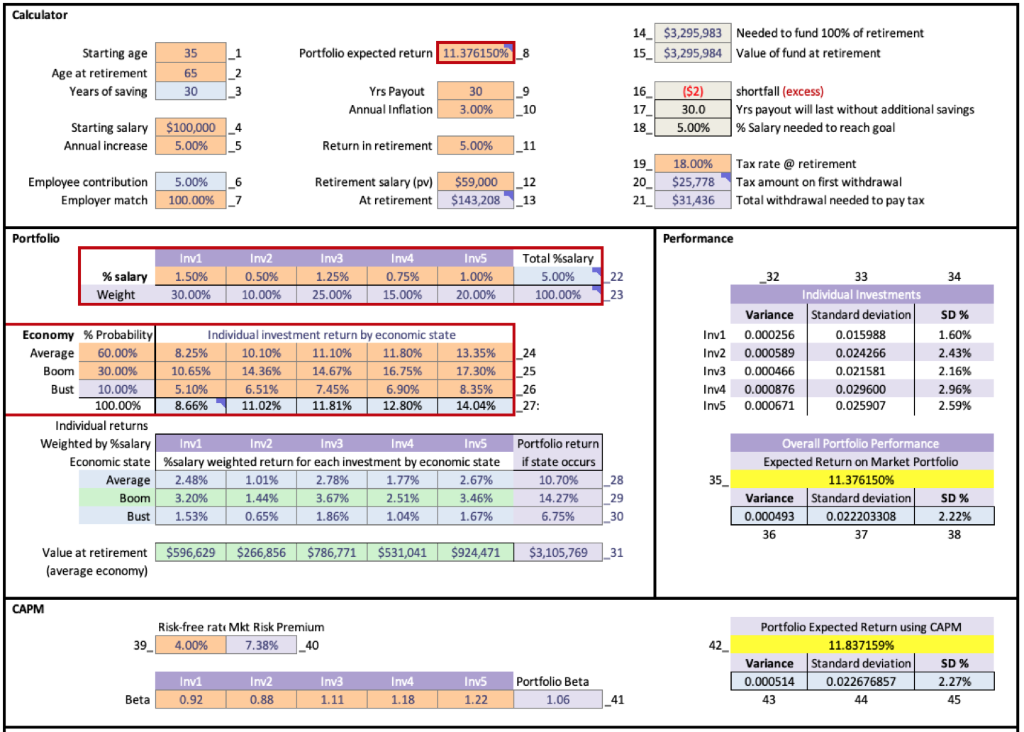
Please note: When you have answered all the cells above correctly, the image below is the inputs that must be in each cell.
Step by Step Solution
There are 3 Steps involved in it
Step: 1

Get Instant Access to Expert-Tailored Solutions
See step-by-step solutions with expert insights and AI powered tools for academic success
Step: 2

Step: 3
Ace Your Homework with AI
Get the answers you need in no time with our AI-driven, step-by-step assistance
Get Started
Enron And World Finance A Case Study In Ethics
Authors: P. Dembinski, C. Lager, A. Cornford, J. Bonvin
1st Edition
1403947635, 978-1403947635