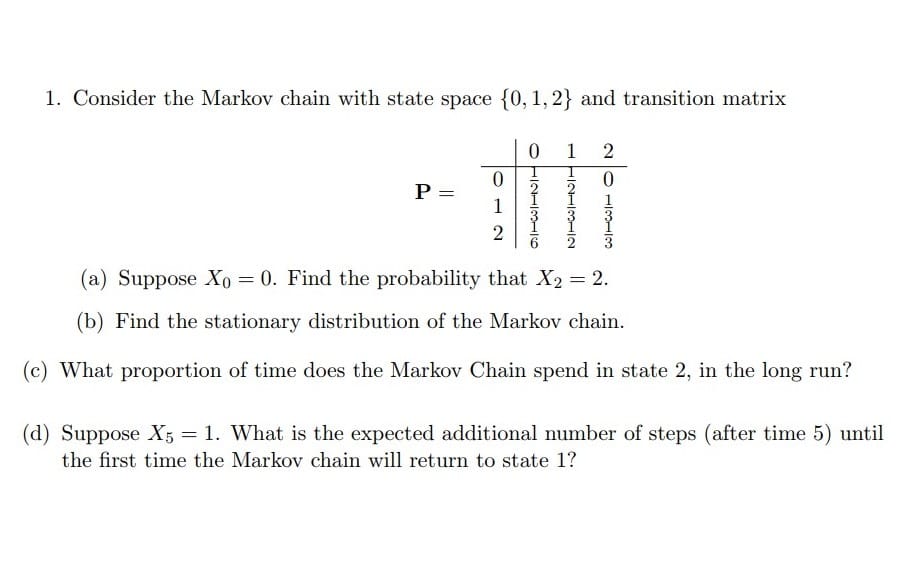
Kindly solve the Stationery distribution of Markov chain
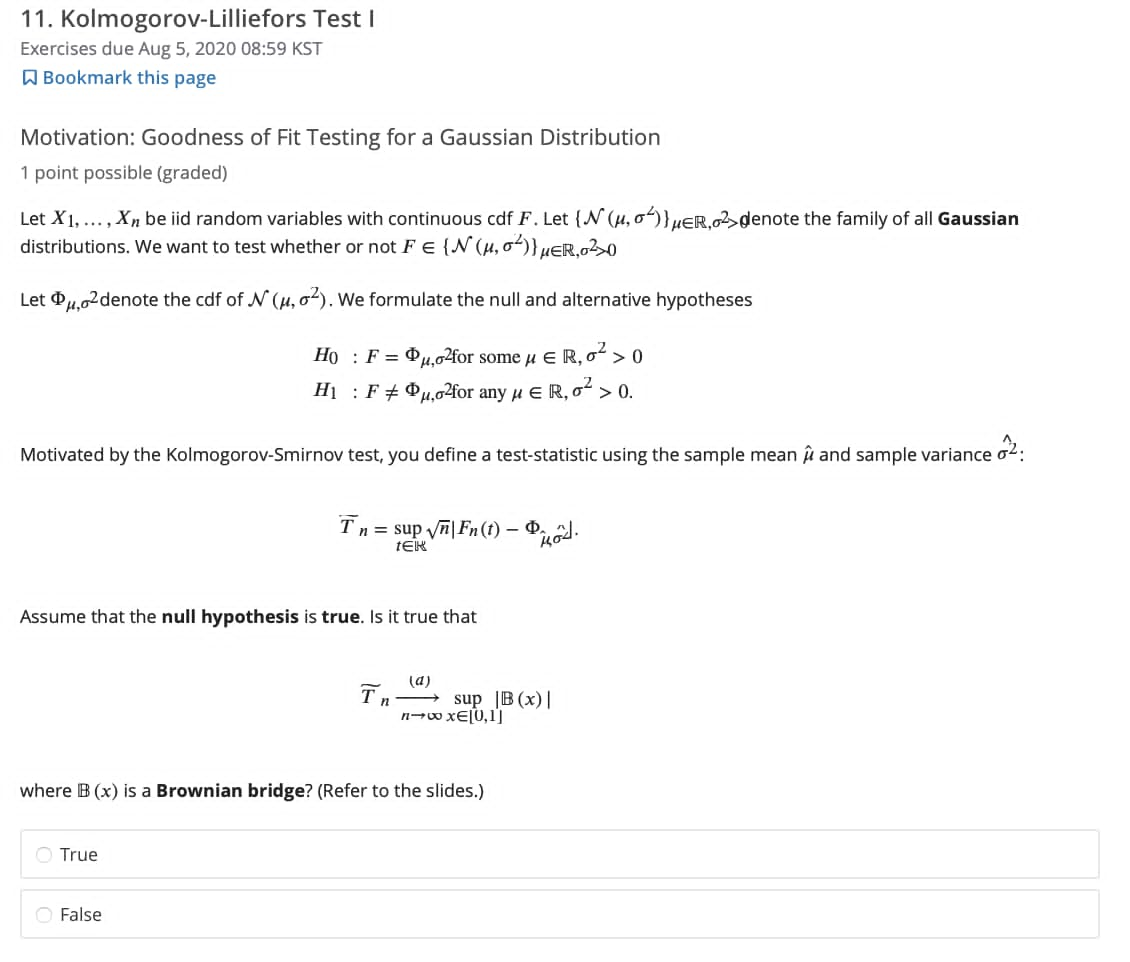
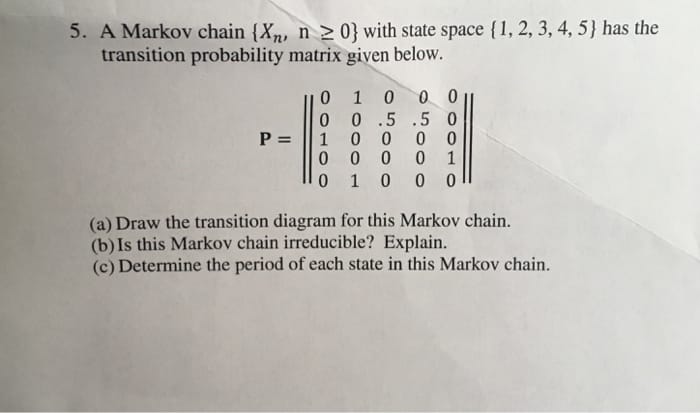
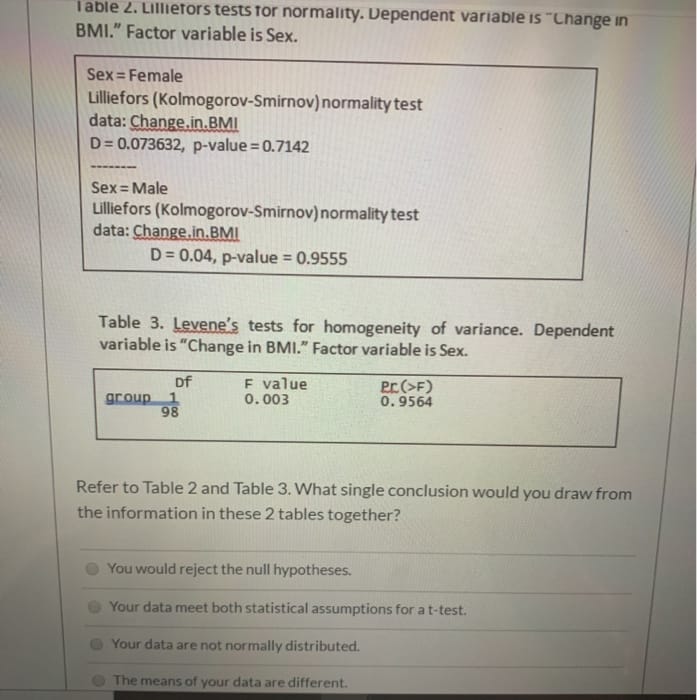
11. Kolmogorov-Lilliefors Test | Exercises due Aug 5, 2020 08:59 KST W Bookmark this page Motivation: Goodness of Fit Testing for a Gaussian Distribution 1 point possible (graded) Let X1, ..., Xn be iid random variables with continuous cdf F. Let {N (u, ") ) ,ER,62> denote the family of all Gaussian distributions. We want to test whether or not FE IN (1, )) HER,a320 Let @,02 denote the cdf of N (1, of). We formulate the null and alternative hypotheses Ho : F = Pu,o2for some H E R, oz > 0 H1 : F # @u,02for any H E R, o- > 0. Motivated by the Kolmogorov-Smirnov test, you define a test-statistic using the sample mean / and sample variance o2: T n = sup Vn| Fn(1) - Q. Hod. Assume that the null hypothesis is true. Is it true that (a) Tn - sup |B (x) | where B (x) is a Brownian bridge? (Refer to the slides.) O True O False(a) Give an example of a logistic regression model which would be an ap propriate use of some (or all) of these variables. Explain why logistic regression is an appropriate choice. (b) Give an example of a Poisson regression model which would be an appropriate use of some (or all) of these variables. Explain Why Poisson regression is an appropriate choice. 5. A Markov chain {X,, n 2 0} with state space { 1, 2, 3, 4, 5 ] has the transition probability matrix given below. DO P = ooono Ooouo OHOOO NOOO OOH (a) Draw the transition diagram for this Markov chain. (b) Is this Markov chain irreducible? Explain. (c) Determine the period of each state in this Markov chain.I able 2. Lillietors tests for normality. Dependent variable is "Change in BMI." Factor variable is Sex. Sex = Female Lilliefors (Kolmogorov-Smirnov) normality test data: Change.in.BMI D= 0.073632, p-value =0.7142 Sex = Male Lilliefors (Kolmogorov-Smirnov) normality test data: Change,in.BMI D = 0.04, p-value = 0.9555 Table 3. Levene's tests for homogeneity of variance. Dependent variable is "Change in BMI." Factor variable is Sex. DF F value PC(>F) group 0. 003 0. 9564 98 Refer to Table 2 and Table 3. What single conclusion would you draw from the information in these 2 tables together? You would reject the null hypotheses. Your data meet both statistical assumptions for a t-test. Your data are not normally distributed. The means of your data are different.\f


