Answered step by step
Verified Expert Solution
Link Copied!

Question

1 Approved Answer

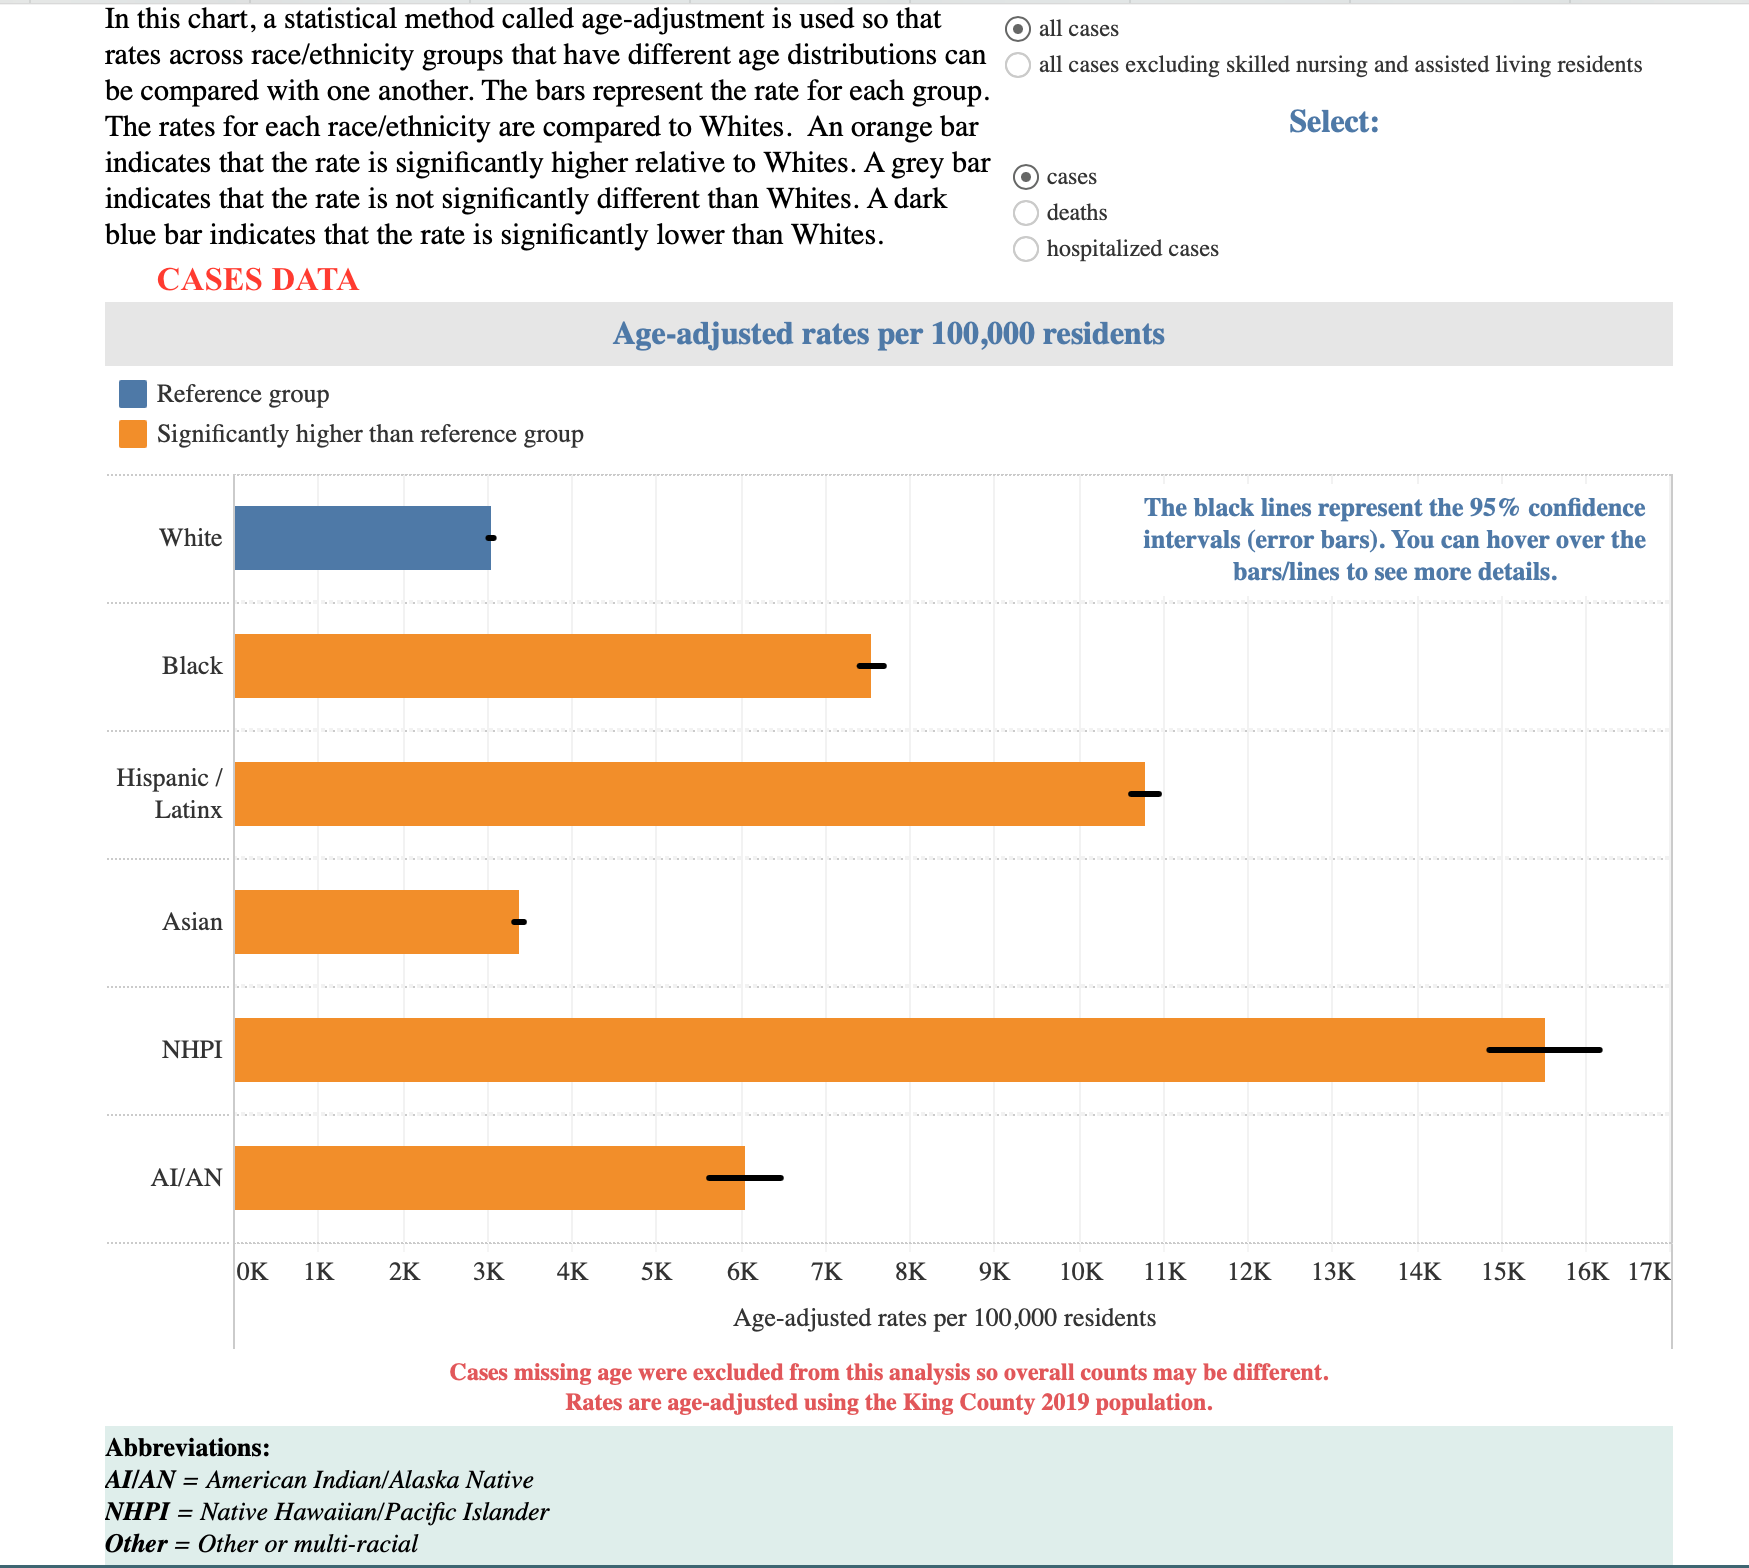
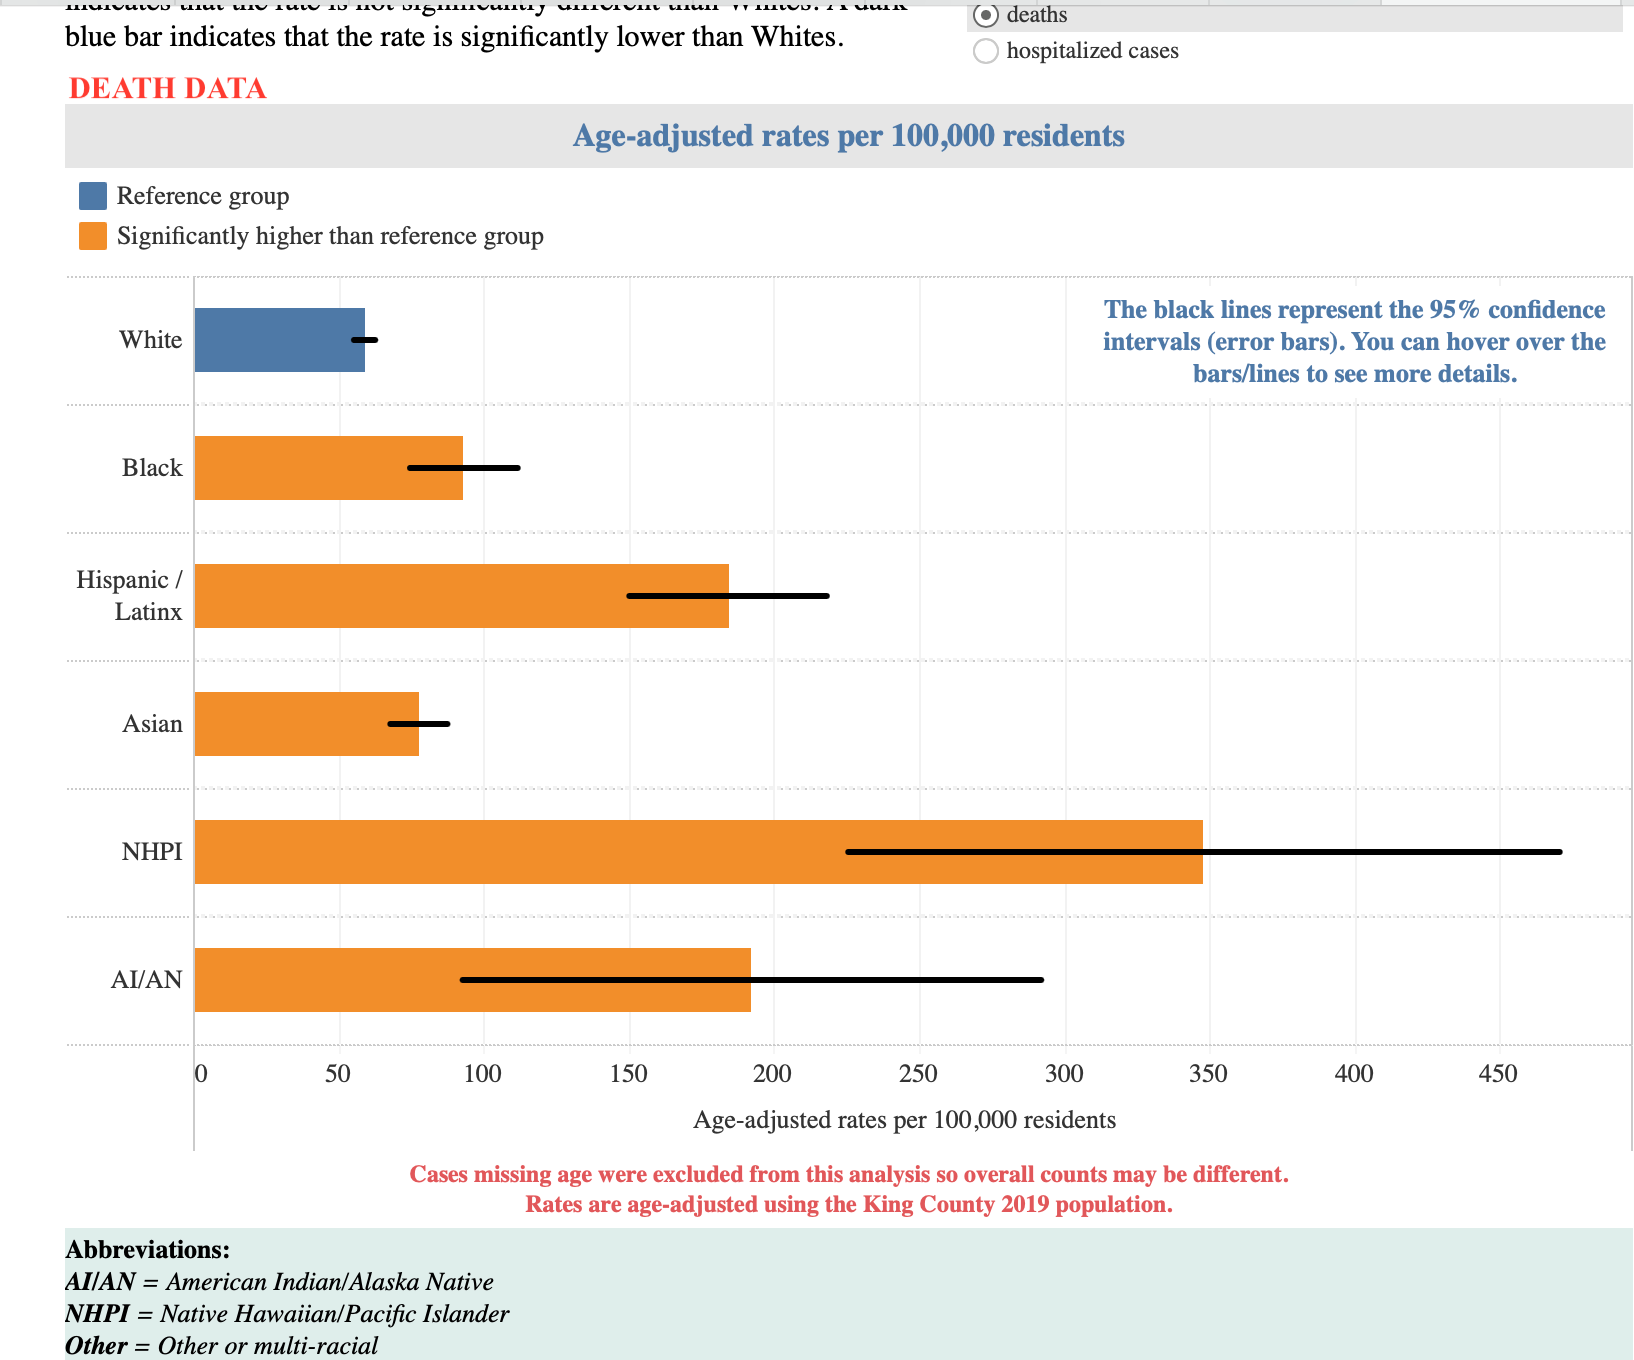
King County Covid-19 cases and deaths: Please use the data to answer the questions. Thank you What is the overall message/story that these graphs collectively

King County Covid-19 cases and deaths: Please use the data to answer the questions. Thank you

  1. What is the overall message/story that these graphs collectively depict about the cases and deaths from COVID-19 in King County?
  2. In both COVID-19 cases and deaths data in King County, which race/ethnic group has the most accuracy in its estimate and which race/ethnic group has the least accuracy in its estimate?

Please use data for cases and death.

image text in transcribedimage text in transcribed
In this chart, a statistical method called age-adjustment is used so that all cases rates across race/ethnicity groups that have different age distributions can ( all cases excluding skilled nursing and assisted living residents be compared with one another. The bars represent the rate for each group. The rates for each race/ethnicity are compared to Whites. An orange bar Select: indicates that the rate is significantly higher relative to Whites. A grey bar O cases indicates that the rate is not significantly different than Whites. A dark deaths blue bar indicates that the rate is significantly lower than Whites. O hospitalized cases CASES DATA Age-adjusted rates per 100,000 residents Reference group Significantly higher than reference group The black lines represent the 95% confidence White intervals (error bars). You can hover over the bars/lines to see more details. Black Hispanic / Latinx Asian NHPI AI/AN OK 1K 2K 3K 4K 5K 6K 7K 8K 9K 10K 11K 12K 13K 14K 15K 16K 17K Age-adjusted rates per 100,000 residents Cases missing age were excluded from this analysis so overall counts may be different. Rates are age-adjusted using the King County 2019 population. Abbreviations: AllAN = American Indian/Alaska Native WHPI = Native Hawaiian/Pacific Islander Other = Other or multi-racialO deaths blue bar indicates that the rate is significantly lower than Whites. O hospitalized cases DEATH DATA Age-adjusted rates per 100,000 residents Reference group Significantly higher than reference group The black lines represent the 95% confidence White intervals (error bars). You can hover over the bars/lines to see more details. Black Hispanic / Latinx Asian NHPI AI/AN 0 50 100 150 200 250 300 350 400 450 Age-adjusted rates per 100,000 residents Cases missing age were excluded from this analysis so overall counts may be different. Rates are age-adjusted using the King County 2019 population. Abbreviations: AllAN = American Indian/ Alaska Native NHPI = Native Hawaiian/Pacific Islander Other = Other or multi-racial

Step by Step Solution

There are 3 Steps involved in it

Step: 1

blur-text-image

Get Instant Access to Expert-Tailored Solutions

See step-by-step solutions with expert insights and AI powered tools for academic success

Step: 2

blur-text-image

Step: 3

blur-text-image

Ace Your Homework with AI

Get the answers you need in no time with our AI-driven, step-by-step assistance

Get Started

Recommended Textbook for

Elementary Linear Algebra Applications Version

Authors: Howard Anton, Chris Rorres

11th Edition

1118879163, 9781118879160

More Books

Students also viewed these Mathematics questions

Question

Hedonic adaptation and the hedonic adaptation prevention model.

Answered: 1 week ago