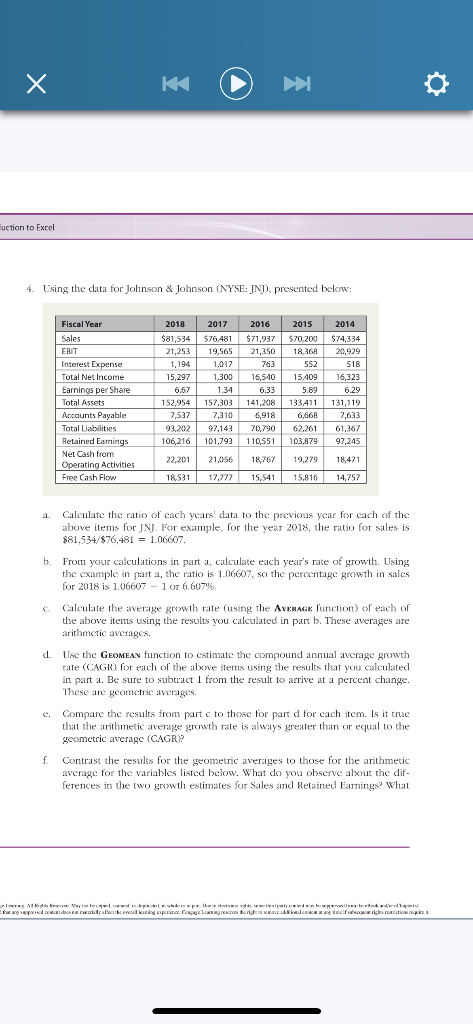
KK luction to Excel 4. Using the data for Johnson & Johnson (NYSE: INT), presented below: 2017 $76,481 19,565 1,017 1.300 2016 $71,937 21,350 763 Fiscal Year Sales EBIT Interest Expense Total Net Income Earnings per Share Total Assets Accounts Payable Total Liabilities Retained Eamings Net Cash from Operating Activities Free Cash Flow 2018 $81,534 21,253 1,194 15,297 6.67 152.954 7,537 93,202 106,216 2015 $70.200 18,368 552 15409 5.89 133411 6,668 62.261 103,479 1.34 2014 $74,334 20,929 518 16,323 6.29 131,119 7,633 61,367 97,245 16,510 6.33 141,204 6,918 70,790 110,551 157,303 7,310 97,143 101.793 21.056 18,764 19,279 18,471 22,201 18,531 17.772 15,541 15,816 14,757 3. b C d Calculate the ratio of cach ycars' data to the previous year for cach of the above items for INJ. For example, for the year 2018, the ratio for sales is $81,534/576,481 - 1.06607. From your calculations in part a, calculate each year's rate of growth. Using the example in part a, the ratio is 1.06607, so the percentage growth in sales for 2018 is 1.06607 - 1 or 6607% Calculate the average growth rate (using the AVERAGE function of each of the above items using the results you calculated in part b. These averages are arithmetic averages. Use the GEOMEAN function to estimate the compound annual average growth rate (CAGR) for each of the above items using the results that you calculated in part a. Be sure to subtract 1 from the result to arrive at a percent change. These are geometric averages Compare the results from partc to those for part d for cach itcm. Is it truc that the arithmetic average growth rate is always greater than or equal to the geometric average (CAGRP Contrast the results for the geometric averages to those for the arithmetic avcrage for the variables listed below. What do you obscrve about the dif- ferences in the two growth estimates for Sales and Retained Earnings? What f NIKK Vidhiwand de alterapia Cervera ricerca KK luction to Excel 4. Using the data for Johnson & Johnson (NYSE: INT), presented below: 2017 $76,481 19,565 1,017 1.300 2016 $71,937 21,350 763 Fiscal Year Sales EBIT Interest Expense Total Net Income Earnings per Share Total Assets Accounts Payable Total Liabilities Retained Eamings Net Cash from Operating Activities Free Cash Flow 2018 $81,534 21,253 1,194 15,297 6.67 152.954 7,537 93,202 106,216 2015 $70.200 18,368 552 15409 5.89 133411 6,668 62.261 103,479 1.34 2014 $74,334 20,929 518 16,323 6.29 131,119 7,633 61,367 97,245 16,510 6.33 141,204 6,918 70,790 110,551 157,303 7,310 97,143 101.793 21.056 18,764 19,279 18,471 22,201 18,531 17.772 15,541 15,816 14,757 3. b C d Calculate the ratio of cach ycars' data to the previous year for cach of the above items for INJ. For example, for the year 2018, the ratio for sales is $81,534/576,481 - 1.06607. From your calculations in part a, calculate each year's rate of growth. Using the example in part a, the ratio is 1.06607, so the percentage growth in sales for 2018 is 1.06607 - 1 or 6607% Calculate the average growth rate (using the AVERAGE function of each of the above items using the results you calculated in part b. These averages are arithmetic averages. Use the GEOMEAN function to estimate the compound annual average growth rate (CAGR) for each of the above items using the results that you calculated in part a. Be sure to subtract 1 from the result to arrive at a percent change. These are geometric averages Compare the results from partc to those for part d for cach itcm. Is it truc that the arithmetic average growth rate is always greater than or equal to the geometric average (CAGRP Contrast the results for the geometric averages to those for the arithmetic avcrage for the variables listed below. What do you obscrve about the dif- ferences in the two growth estimates for Sales and Retained Earnings? What f NIKK Vidhiwand de alterapia Cervera ricerca