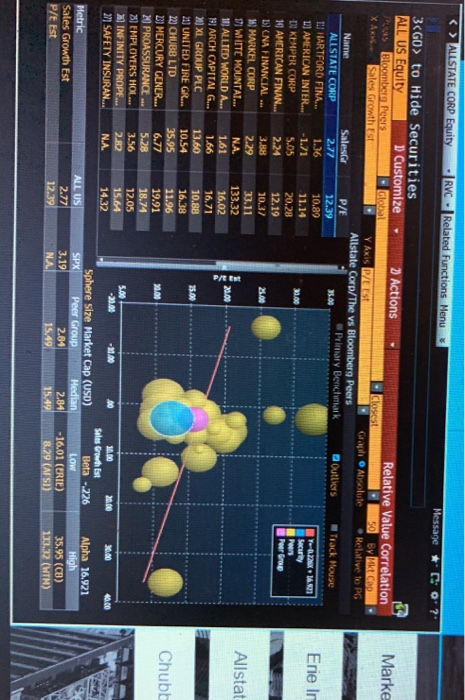
KNOWLEDGE CHECK This chart shows a scatterplot with the x-axis being the estimated sales growth and the y-axis being the estimated PE multiple. Given this data alone, which of the following companies may warrant further analysis by a portfolio manager looking to buy an insurance company for her portfolio Markel Ve Erie Indemnity Allstate Chubb te Click to open/close chart PREV SUBMIT ALLSTATE CORP Equity RVC. Related Functions Menus Message *CO? 3
to Hide Securities ALL US Equity 1 Customize PLUS Bloomberg Peers Global X AX Sales Growth Est KE Relative Value Correlation 50 By Mkt Cap Absolute Relative to PG Actions Closest Y AXIS P/E EST Gap Allstate Corp/The vs Bloomberg Peers Primary Benchmark Marke Outliers Tack House 22 Security .14.21 Sales 2.77 1.36 -1.71 5.05 2.24 3.88 2.29 Erie In re NA Allstat Name ALLSTATE CORP TU HARTFORD FINA... 1) AMERICAN INTER... DI KEMPER CORP 19 AMERICAN FINAN... L) NA FINANCIAL ... 3) MARKEL CORP DI WIITE MOUNTAL... 1 ALLIED WORLD A.. 14 ARCH CAPITAL G... 21 XL GROUP PLC 21) UNITED FIRE GR... 22) CHUBB LTD BI MERCURY GENER.. 20 PROASSURANCE 2) EMPLOYERS HOL... 2) INFINITY PROPE... 27) SAFETY INSURAN... 1.61 1.66 13.60 10.54 35.95 6.77 5.28 3.56 2.82 P/E 12.39 10.89 11.14 20.28 12.19 10,37 33.11 133.32 16.02 16.71 10.88 16.38 11.96 19.91 18.74 12.05 15.64 14.32 Chubb NA Metric Sales Growth Est P/E Est LOW 14.00 Sales Growth Est Sphere Size Market Cap (USD) Beta - 226 SPX Peer Group Median 3.19 2.84 2.84 -16.01 (ERIE) NA 15.49 15.498 .29 (AFSI) ALL US 2.77 12.39 Alpha 16.921 High 35.95 (CB) 133.32 (WIN) KNOWLEDGE CHECK This chart shows a scatterplot with the x-axis being the estimated sales growth and the y-axis being the estimated PE multiple. Given this data alone, which of the following companies may warrant further analysis by a portfolio manager looking to buy an insurance company for her portfolio Markel Ve Erie Indemnity Allstate Chubb te Click to open/close chart PREV SUBMIT ALLSTATE CORP Equity RVC. Related Functions Menus Message *CO? 3 to Hide Securities ALL US Equity 1 Customize PLUS Bloomberg Peers Global X AX Sales Growth Est KE Relative Value Correlation 50 By Mkt Cap Absolute Relative to PG Actions Closest Y AXIS P/E EST Gap Allstate Corp/The vs Bloomberg Peers Primary Benchmark Marke Outliers Tack House 22 Security .14.21 Sales 2.77 1.36 -1.71 5.05 2.24 3.88 2.29 Erie In re NA Allstat Name ALLSTATE CORP TU HARTFORD FINA... 1) AMERICAN INTER... DI KEMPER CORP 19 AMERICAN FINAN... L) NA FINANCIAL ... 3) MARKEL CORP DI WIITE MOUNTAL... 1 ALLIED WORLD A.. 14 ARCH CAPITAL G... 21 XL GROUP PLC 21) UNITED FIRE GR... 22) CHUBB LTD BI MERCURY GENER.. 20 PROASSURANCE 2) EMPLOYERS HOL... 2) INFINITY PROPE... 27) SAFETY INSURAN... 1.61 1.66 13.60 10.54 35.95 6.77 5.28 3.56 2.82 P/E 12.39 10.89 11.14 20.28 12.19 10,37 33.11 133.32 16.02 16.71 10.88 16.38 11.96 19.91 18.74 12.05 15.64 14.32 Chubb NA Metric Sales Growth Est P/E Est LOW 14.00 Sales Growth Est Sphere Size Market Cap (USD) Beta - 226 SPX Peer Group Median 3.19 2.84 2.84 -16.01 (ERIE) NA 15.49 15.498 .29 (AFSI) ALL US 2.77 12.39 Alpha 16.921 High 35.95 (CB) 133.32 (WIN)