

Answered step by step
Verified Expert Solution
Question
1 Approved Answer
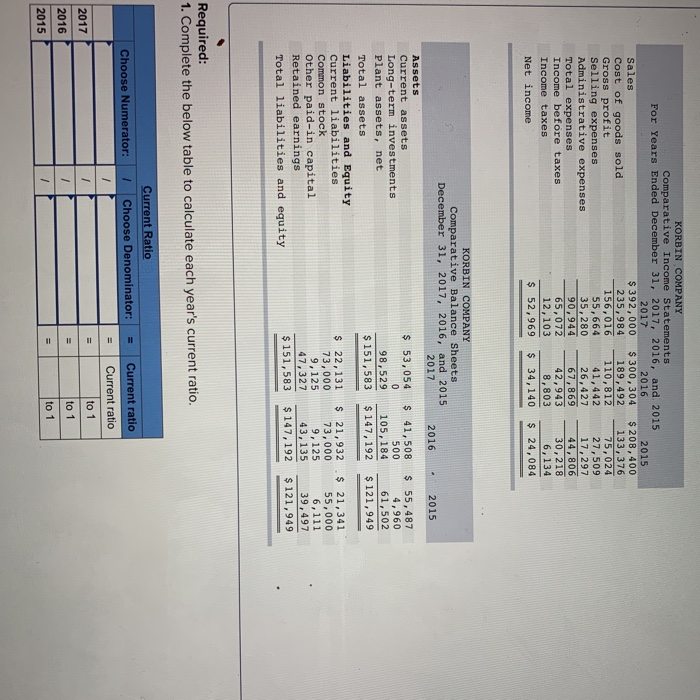
KORBIN COMPANY Comparative Income Statements For Years Ended December 31, 2017, 2016, and. 2015 2015 2017 2016 392,000 $ 300,304 $208,400 Sales Cost of goods
Step by Step Solution
There are 3 Steps involved in it
Step: 1

Get Instant Access to Expert-Tailored Solutions
See step-by-step solutions with expert insights and AI powered tools for academic success
Step: 2

Step: 3
Ace Your Homework with AI
Get the answers you need in no time with our AI-driven, step-by-step assistance
Get Started
Operational Profitability Conducting Management Audits
Authors: Robert M. Torok, Patrick J. Cordon
1st Edition
0471172251, 978-0471172253