Answered step by step
Verified Expert Solution
Link Copied!

Question

1 Approved Answer

KORBIN COMPANY Comparative Income Statements For Years Ended December 31, 2017, 2016, and 2015 2017 549,816 $421,204 $292,300 2016 2015 Sales Cost of goods sold
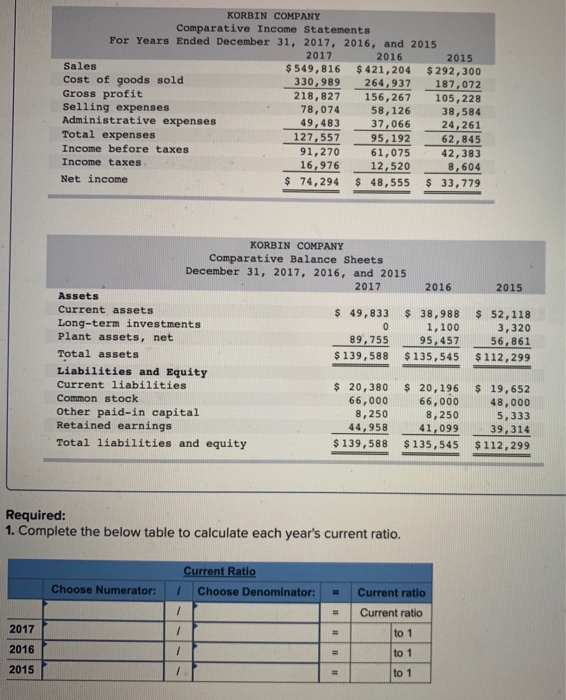
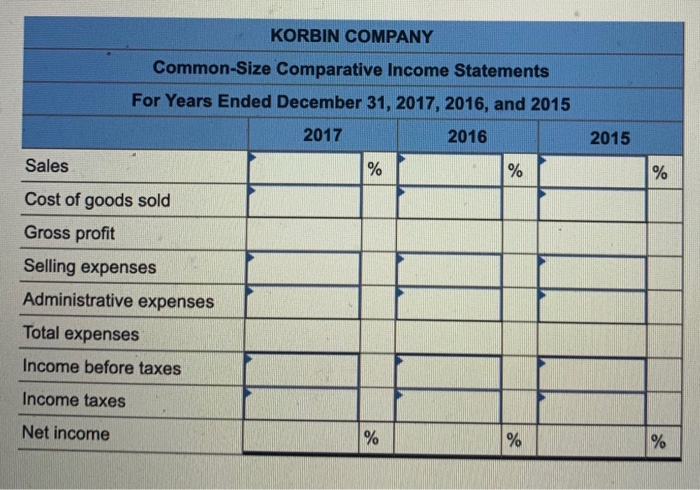
image text in transcribed
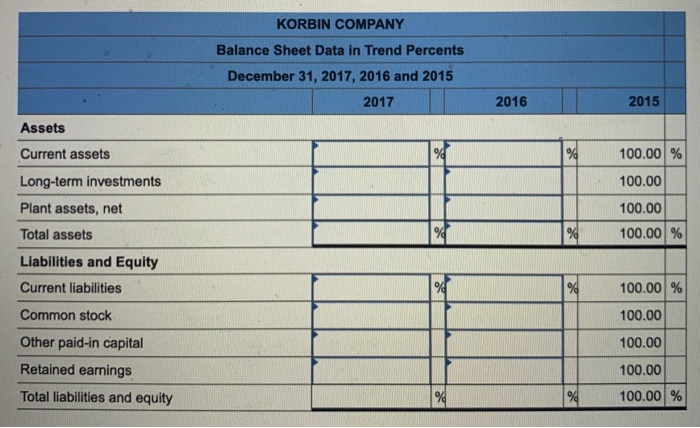
KORBIN COMPANY Comparative Income Statements For Years Ended December 31, 2017, 2016, and 2015 2017 549,816 $421,204 $292,300 2016 2015 Sales Cost of goods sold Gross profit 330,989264,937187,072 218,827 156,267 105,228 78,07458,126 38,584 37,066 95,192 61,075 12,520 Se111 prorit Selling expenses Administrative expenses Total expenses Income before taxes Income taxes Net income 49,483 127.557 91,270 24,261 62,845 42,383 8,604 33,779 16,976 $ 74,294 48,555 KORBIN COMPANY Comparative Balance Sheets December 31, 2017, 2016, and 2015 2017 2016 2015 Assets Current assets Long-term investmentsS Plant assets, net Total assets $ 49,833 38,988 52,118 3, 320 56,861 $139,588 $135,545 $ 112,299 1,100 95,457 89,755 9 AS Liabilities and Equity Current liabilities Common stock Other paid-in capital Retained earnings Total liabilities and equity 20,380 20,196 $ 19,652 48,000 5,333 41,099 39.314 $139,588 $135,545 $112,299 66,000 66,000 8,250 8,250 44,958 Required: 1. Complete the below table to calculate each year's current ratio. Current Ratio Choose Numerator: | / Choose Denominator: I = current ratio Current ratio 2017 2016 2015 to 1 to 1 to 1 KORBIN COMPANY Common-Size Comparative Income Statements For Years Ended December 31, 2017, 2016, and 2015 2017 2016 2015 Sales Cost of goods sold Gross proft Selling expenses Administrative expenses Total expenses Income before taxes Income taxes Net income KORBIN COMPANY Balance Sheet Data in Trend Percents December 31, 2017, 2016 and 2015 2017 2016 2015 Assets Current assets Long-term investments Plant assets, net Total assets Liabilities and Equity Current liabilities Common stock Other paid-in capital Retained earnings Total liabilities and equity 100.001 % 100.00 100.00 100.001 % 100.001 % 100.00 100.00 100.00 100.001 % 9%
Step by Step Solution

There are 3 Steps involved in it

Step: 1

blur-text-image

Get Instant Access to Expert-Tailored Solutions

See step-by-step solutions with expert insights and AI powered tools for academic success

Step: 2

blur-text-image

Step: 3

blur-text-image

Ace Your Homework with AI

Get the answers you need in no time with our AI-driven, step-by-step assistance

Get Started

Recommended Textbook for

Fraud examination

Authors: Steve Albrecht, Chad Albrecht, Conan Albrecht, Mark zimbelma

4th edition

538470844, 978-0538470841

More Books

Students also viewed these Accounting questions