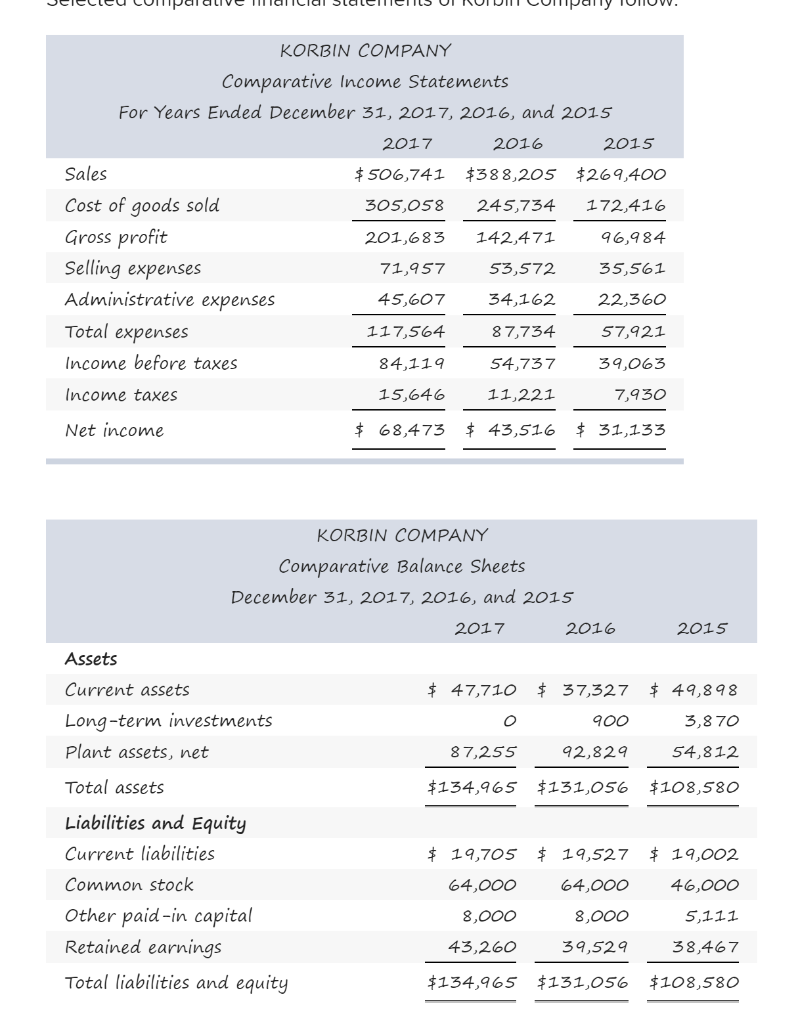
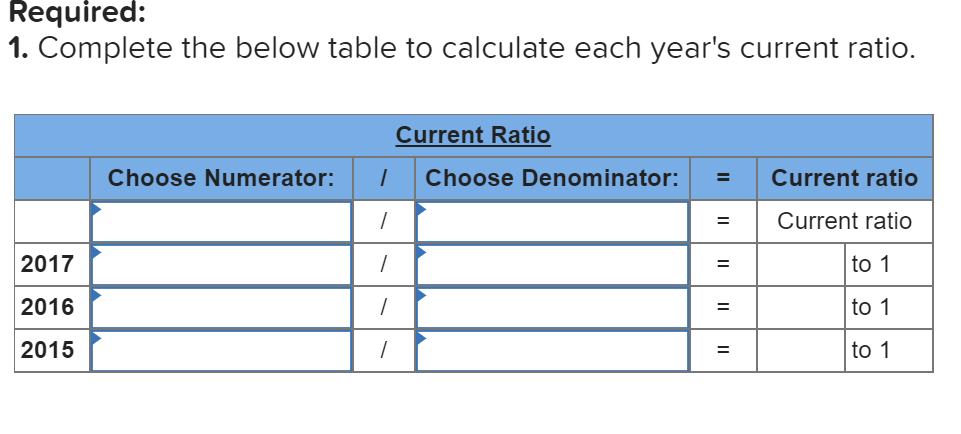
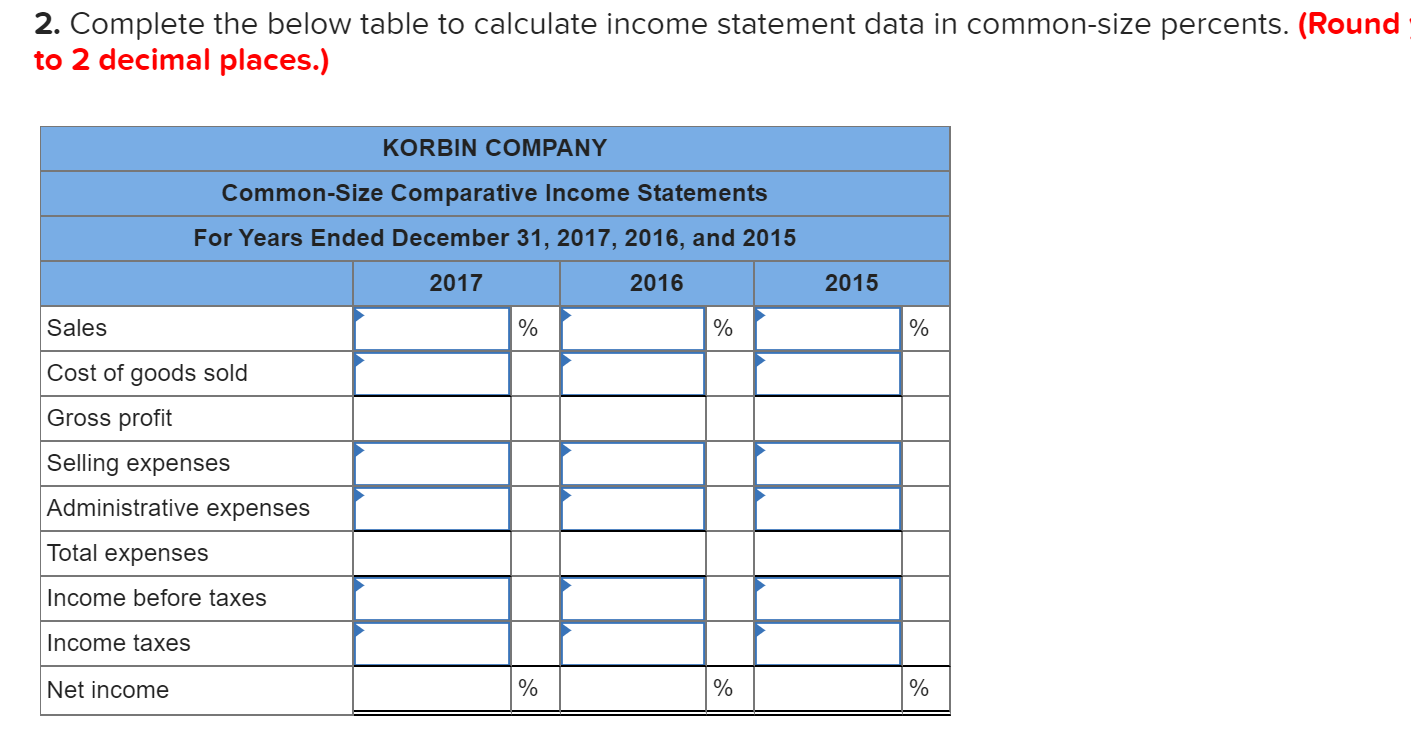
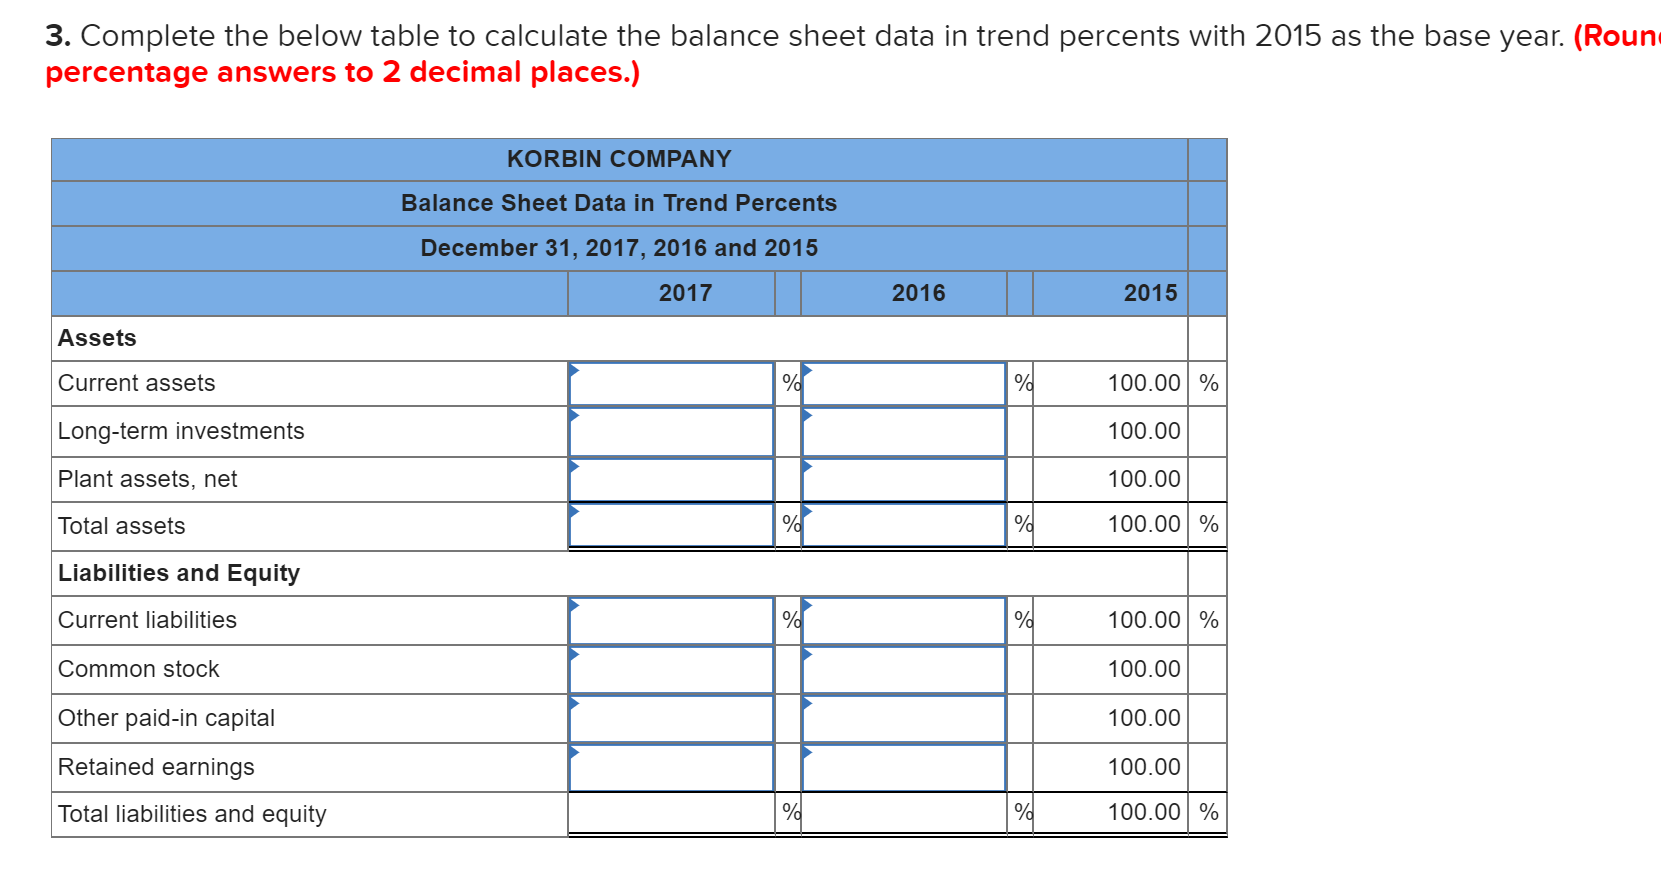
KORBIN COMPANY Comparative Income Statements For Years Ended December 31, 2017, 2016, and 2015 2017 2016 2015 $ 506,741 $388,205 $269,400 305,058 245,734 172,416 201,683 142,471 96,984 Sales Cost of goods sold Gross profit Selling expenses Administrative expenses Total expenses Income before taxes 71,957 53,572 35,561 45,607 34,162 22,360 117,564 87,734 57,921 84,119 54,737 39,063 Income taxes 15,646 11,221 7,930 Net income $ 68,473 $ 43,516 $ 31,133 KORBIN COMPANY Comparative Balance Sheets December 31, 2017, 2016, and 2015 2017 2016 2015 Assets $ 47,710 $ 37,327 $ 49,898 Current assets Long-term investments Plant assets, net 900 3,870 87,255 92,829 54,812 Total assets $134,965 $131,056 $108,580 $ 19,705 $ 19,527 $ 19,002 64,000 64,000 46,000 Liabilities and Equity Current liabilities Common stock Other paid-in capital Retained earnings Total liabilities and equity 8,000 8,000 5,111 43,260 39,529 38,467 $134,965 $131,056 $108,580 Required: 1. Complete the below table to calculate each year's current ratio. Current Ratio Choose Numerator: 1 Choose Denominator: Current ratio Current ratio 2017 1 to 1 2016 1 to 1 2015 1 to 1 2. Complete the below table to calculate income statement data in common-size percents. (Round to 2 decimal places.) KORBIN COMPANY Common-Size Comparative Income Statements For Years Ended December 31, 2017, 2016, and 2015 2017 2016 2015 Sales % % % Cost of goods sold Gross profit Selling expenses Administrative expenses Total expenses Income before taxes Income taxes Net income % % % 3. Complete the below table to calculate the balance sheet data in trend percents with 2015 as the base year. (Roun percentage answers to 2 decimal places.) KORBIN COMPANY Balance Sheet Data in Trend Percents December 31, 2017, 2016 and 2015 2017 2016 2015 Assets Current assets % ed 100.00 % Long-term investments 100.00 Plant assets, net 100.00 Total assets % ad 100.00 % Liabilities and Equity Current liabilities % 100.00 % Common stock 100.00 Other paid-in capital 100.00 Retained earnings 100.00 Total liabilities and equity % % 100.00 %