

Answered step by step
Verified Expert Solution
Question
1 Approved Answer
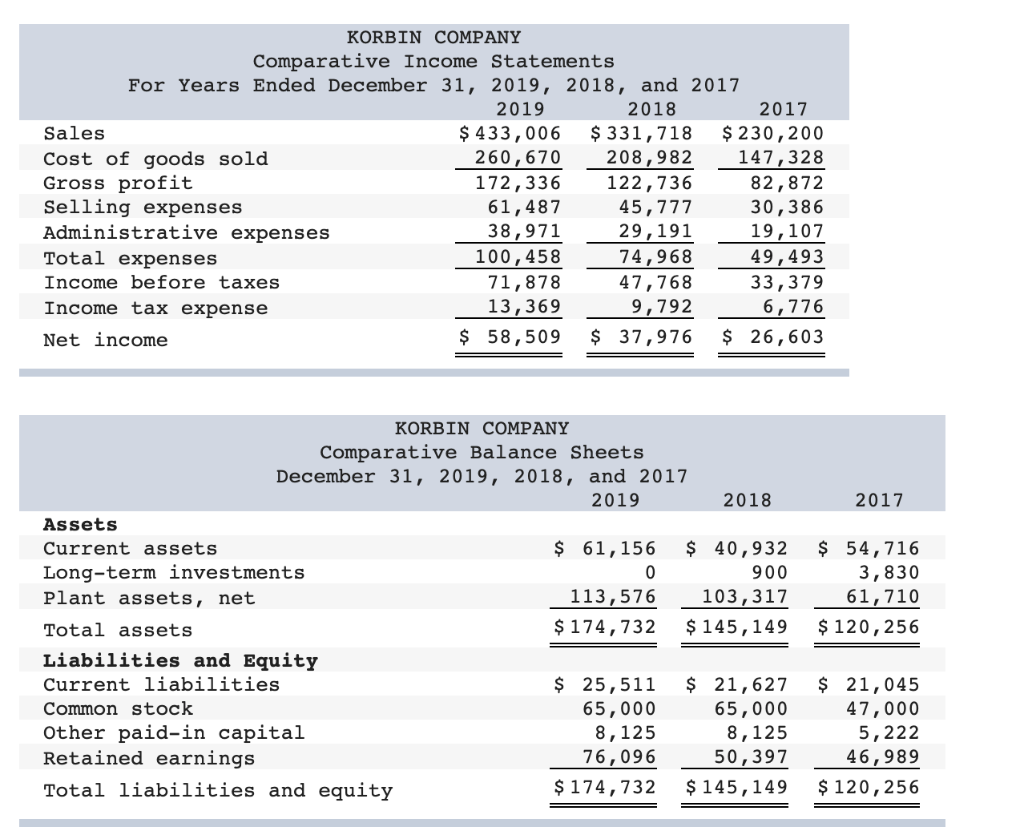
KORBIN COMPANY Comparative Income Statements For Years Ended December 31, 2019, 2018, and 2017 2019 2018 2017 Sales $ 433,006 $ 331,718 $ 230, 200
Step by Step Solution
There are 3 Steps involved in it
Step: 1

Get Instant Access to Expert-Tailored Solutions
See step-by-step solutions with expert insights and AI powered tools for academic success
Step: 2

Step: 3
Ace Your Homework with AI
Get the answers you need in no time with our AI-driven, step-by-step assistance
Get Started
The Politics Of Financial Risk Audit And Regulation
Authors: Atul Shah
1st Edition
1138042358, 978-1138042353