Answered step by step
Verified Expert Solution
Question
1 Approved Answer
KORBIN COMPANY Comparative Income Statements For Years Ended December 31, 2019, 2018, and 2017 2019 2018 2017 Sales $ 503,920 $ 386,044 $ 267,900 Cost
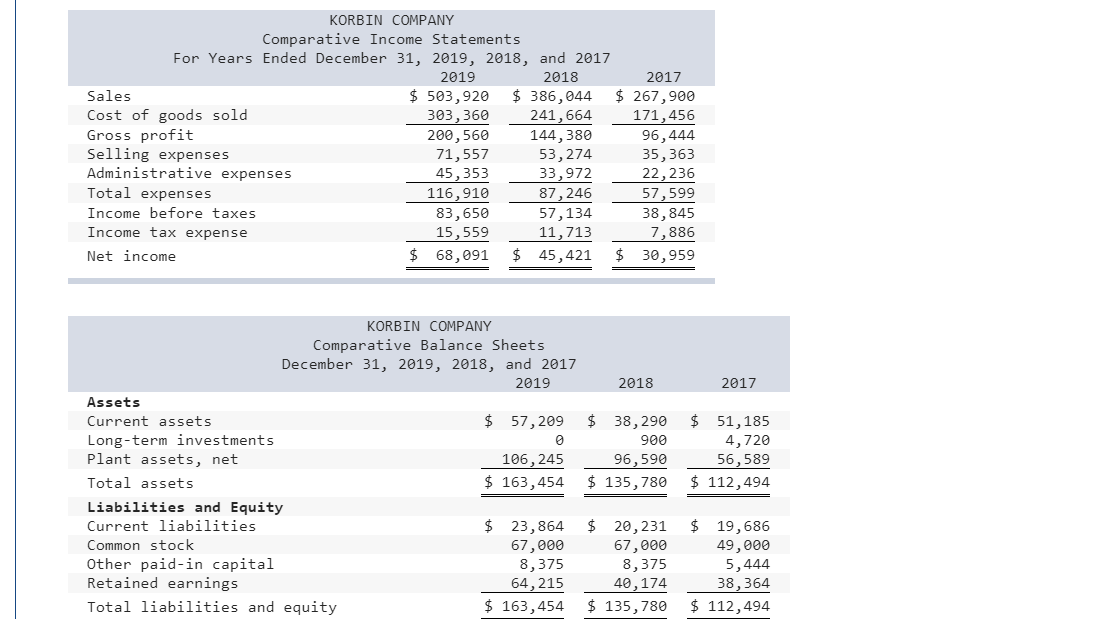
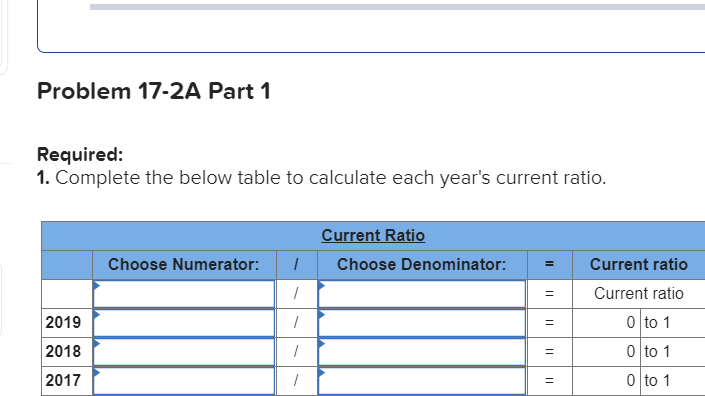
KORBIN COMPANY Comparative Income Statements For Years Ended December 31, 2019, 2018, and 2017 2019 2018 2017 Sales $ 503,920 $ 386,044 $ 267,900 Cost of goods sold 303,360 241,664 171,456 Gross profit 200,560 144,380 96,444 Selling expenses 71,557 53, 274 35,363 Administrative expenses 45,353 33,972 22,236 Total expenses 116,910 87,246 57,599 Income before taxes 83,650 57,134 38,845 Income tax expense 15,559 11,713 7,886 Net income $ 68,091 $ 45,421 $ 30,959 2018 2017 KORBIN COMPANY Comparative Balance Sheets December 31, 2019, 2018, and 2017 2019 Assets Current assets $ 57,209 Long-term investments Plant assets, net 106, 245 Total assets $ 163,454 Liabilities and Equity Current liabilities $ 23,864 Common stock 67,000 Other paid-in capital 8,375 Retained earnings 64, 215 Total liabilities and equity $ 163,454 $ 38,290 900 96,590 $ 135,780 $ 51,185 4,720 56,589 $ 112,494 $ 20,231 67,000 8,375 40,174 $ 135,780 $ 19,686 49,000 5,444 38, 364 $ 112,494 Problem 17-2A Part 1 Required: 1. Complete the below table to calculate each year's current ratio. Current Ratio Choose Numerator: Choose Denominator: = Current ratio Current ratio - 0 to 1 2019 2018 - 0 to 1 2017 11 0 to 1
Step by Step Solution
There are 3 Steps involved in it
Step: 1
Get Instant Access to Expert-Tailored Solutions
See step-by-step solutions with expert insights and AI powered tools for academic success
Step: 2
Step: 3
Ace Your Homework with AI
Get the answers you need in no time with our AI-driven, step-by-step assistance
Get Started