Answered step by step
Verified Expert Solution
Question
1 Approved Answer
KORBIN COMPANY Comparative Income Statements For Years Ended December 31 2021 2020 Sales $ 404,039 $ 309,527 2019 $ 214,800 Cost of goods sold

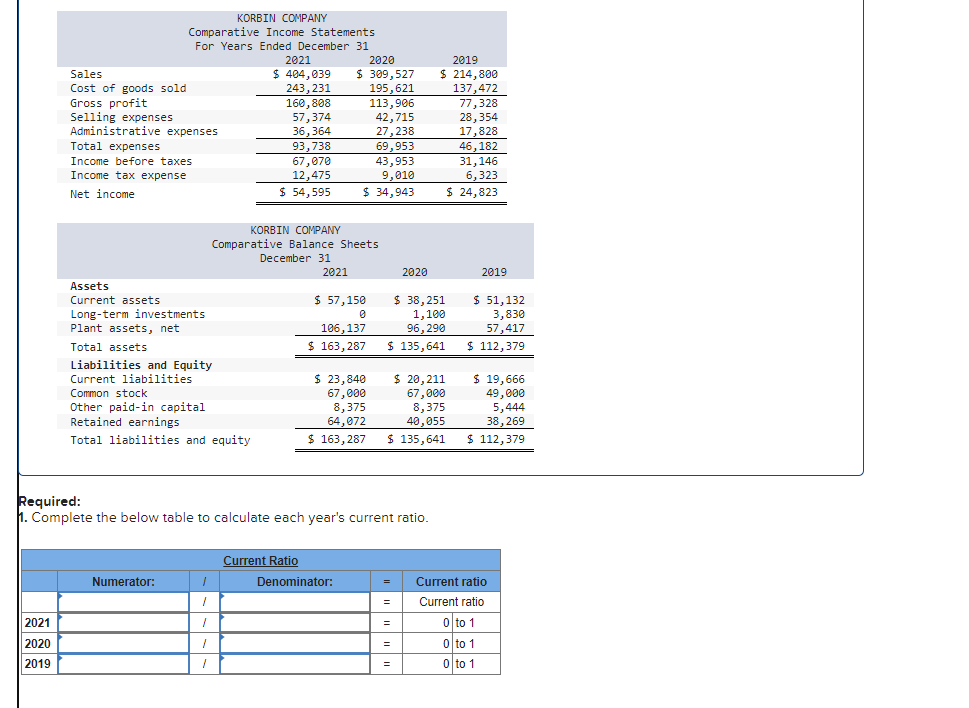
KORBIN COMPANY Comparative Income Statements For Years Ended December 31 2021 2020 Sales $ 404,039 $ 309,527 2019 $ 214,800 Cost of goods sold 243,231 195,621 137,472 Gross profit 160,808 113,906 77,328 Selling expenses 57,374 42,715 28,354 Administrative expenses 36,364 27,238 17,828 Total expenses 93,738 69,953 46,182 Income before taxes 67,070 43,953 31,146 Income tax expense Net income 12,475 9,010 6,323 $ 54,595 $ 34,943 $ 24,823 KORBIN COMPANY Comparative Balance Sheets December 31 2021 Assets Current assets $ 57,150 Long-term investments 0 Plant assets, net 106,137 Total assets $ 163,287 $ 135,641 Liabilities and Equity Current liabilities Common stock Other paid-in capital Retained earnings $ 23,840 67,000 8,375 64,072 $ 20,211 67,000 8,375 40,055 2020 $ 38,251 1,100 96,290 2019 $ 51,132 3,830 57,417 $ 112,379 $ 19,666 49,000 5,444 38,269 Total liabilities and equity $ 163,287 $ 135,641 $ 112,379 Required: 1. Complete the below table to calculate each year's current ratio. 2021 2020 2019 Numerator: Current Ratio Denominator: = Current ratio = Current ratio = 0 to 1 = 0 to 1 = 0 to 1
Step by Step Solution
There are 3 Steps involved in it
Step: 1

Get Instant Access to Expert-Tailored Solutions
See step-by-step solutions with expert insights and AI powered tools for academic success
Step: 2

Step: 3

Ace Your Homework with AI
Get the answers you need in no time with our AI-driven, step-by-step assistance
Get Started


