Question
Krane Products Inc. is a manufacturer of ski equipment. The company has been in operation since 2012. Ms. Andrews is a credit analyst for an
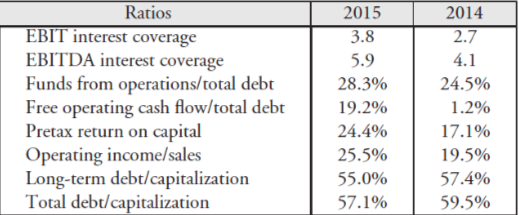
Krane Products Inc. is a manufacturer of ski equipment. The company has been in operation since 2012. Ms. Andrews is a credit analyst for an investment management company. She has been asked to analyze Krane Products as a possible purchase for the bond portfolio of one of her firms accounts. At the time of the analysis, Krane Products Inc. was rated BB by S&P. The bonds of the company trade in the market with the same spread as other comparable BB bonds. Ms. Andrews collected financial data for Krane Products Inc. for the years 2015 and 2014 and computed several financial ratios. Information for selected ratios is given below:

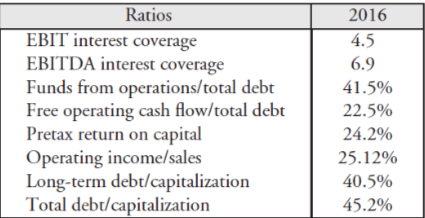
Based on the first three quarters of fiscal year 2016, Ms. Andrews projected the following ratios for 2016:

Ms. Andrews obtained from S&P information about median ratios by credit rating. These ratios are reproduced as follows:

What do you think Ms. Andrews recommendation will be with respect to the purchase of the bonds of Krane Products Inc.? Explain why.
Ratios 2015 2014 2.7 EBIT interest coverage EBITDA interest coverage Funds from operations/total debt Free operating cash flow/total debt Pretax return on capital Operating income/sales Long-term debt/capitalization Total debt/capitalization 5.9 28.3% 19.2% 24.490 25.5% 55.0% 57.190 24.5% 1.2% 19.5% 57.4% 59.590 Ratios EBIT interest coverage EBITDA interest coverage Funds from operations/total debt Free operating cash flow/total debt Pretax return on capital 2016 4.5 6.9 41.5% 22.5% 24.2% 25.12% 405% 45.2% perating income/sales Long-term debt/capitalization Total debt/capitalization 12.9 18.7 14.0 10.0 89.7 67.0 49.5 32.3 20. 10.5 2.5 3.9 EBIT interest coverage EBITDA interest coverage Funds from operations/total debt Free operating cash flow/total debt40.52617.46.3 .0(4.0) Pretax return on capital Operating income/sales Long-term debt/capitalization Total debt/capitalization 9.2 7.2 6.3 2.3 30.6 25.19.6 5.4 12.6 30.9 25.217.95.814.411.2 21.4 29.333.340.8 55.3 68.8 31.8 37.0 39.2 46.458.571.4 9.2 Ratios 2015 2014 2.7 EBIT interest coverage EBITDA interest coverage Funds from operations/total debt Free operating cash flow/total debt Pretax return on capital Operating income/sales Long-term debt/capitalization Total debt/capitalization 5.9 28.3% 19.2% 24.490 25.5% 55.0% 57.190 24.5% 1.2% 19.5% 57.4% 59.590 Ratios EBIT interest coverage EBITDA interest coverage Funds from operations/total debt Free operating cash flow/total debt Pretax return on capital 2016 4.5 6.9 41.5% 22.5% 24.2% 25.12% 405% 45.2% perating income/sales Long-term debt/capitalization Total debt/capitalization 12.9 18.7 14.0 10.0 89.7 67.0 49.5 32.3 20. 10.5 2.5 3.9 EBIT interest coverage EBITDA interest coverage Funds from operations/total debt Free operating cash flow/total debt40.52617.46.3 .0(4.0) Pretax return on capital Operating income/sales Long-term debt/capitalization Total debt/capitalization 9.2 7.2 6.3 2.3 30.6 25.19.6 5.4 12.6 30.9 25.217.95.814.411.2 21.4 29.333.340.8 55.3 68.8 31.8 37.0 39.2 46.458.571.4 9.2Step by Step Solution
There are 3 Steps involved in it
Step: 1

Get Instant Access to Expert-Tailored Solutions
See step-by-step solutions with expert insights and AI powered tools for academic success
Step: 2

Step: 3

Ace Your Homework with AI
Get the answers you need in no time with our AI-driven, step-by-step assistance
Get Started


