

Answered step by step
Verified Expert Solution
Question
1 Approved Answer
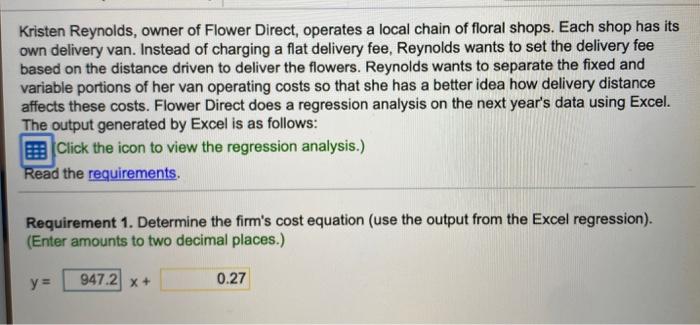
Kristen Reynolds, owner of Flower Direct, operates a local chain of floral shops. Each shop has its own delivery van. Instead of charging a flat

Step by Step Solution
There are 3 Steps involved in it
Step: 1

Get Instant Access to Expert-Tailored Solutions
See step-by-step solutions with expert insights and AI powered tools for academic success
Step: 2

Step: 3
Ace Your Homework with AI
Get the answers you need in no time with our AI-driven, step-by-step assistance
Get Started
Kamishibai Boards A Lean Visual Management System That Supports Layered Audits
Authors: Joseph Niederstadt
1st Edition
1482205297, 978-1482205299