

Question
KTMB would like to monitor commuter delays at peak hours every morning of the working day for 4 weeks. If a commuter arrives more than
KTMB would like to monitor commuter delays at peak hours every morning of the working day for 4 weeks. If a commuter arrives more than 5 minutes from scheduled, it is considered to arrive late. A total of 235 commuters are scheduled for the morning of this peak time. The following is a record of arrival delays for 5 working days for a period of 4 weeks monitoring. 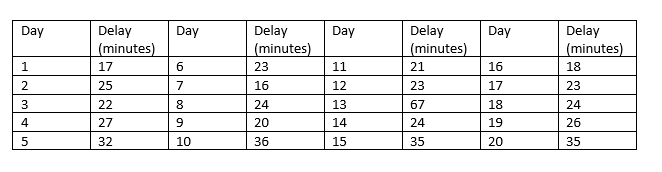 a) Build an appropriate control chart to illustrate the proportion of arrival delays of commuter for the above data.
i) State whether commuter arrivals are still within statistical controlduring this monitoring period.
b) What effect can you give on your conclusion in (a) if finding heavy rain on the 13th day? c) If on the 13th day the delay recorded is equivalent to 47 minutes, what is the effect of monitoring on the control chart you have constructed in (a).
Day Day Day Day Delay (minutes) 17 Delay (minutes) 23 Delay (minutes) 21 Delay (minutes) 18 1 6 11 16 2 25 7 16 12 23 17 23 3 22 8 24 13 67 18 24 4 27 9 20 14 24 19 26 5 32 10 36 15 35 20 35 Day Day Day Day Delay (minutes) 17 Delay (minutes) 23 Delay (minutes) 21 Delay (minutes) 18 1 6 11 16 2 25 7 16 12 23 17 23 3 22 8 24 13 67 18 24 4 27 9 20 14 24 19 26 5 32 10 36 15 35 20 35Step by Step Solution
There are 3 Steps involved in it
Step: 1

Get Instant Access to Expert-Tailored Solutions
See step-by-step solutions with expert insights and AI powered tools for academic success
Step: 2

Step: 3
Ace Your Homework with AI
Get the answers you need in no time with our AI-driven, step-by-step assistance
Get Started
Trusted Advisors Key Attributes Of Outstanding Internal Auditors
Authors: Richard F. Chambers, President And CEO Of The IIA
1st Edition
0894139819, 978-0894139819