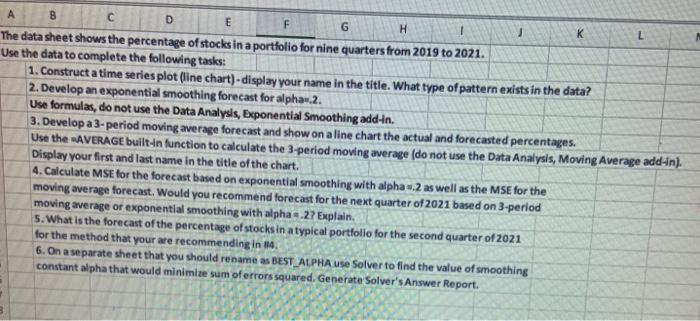
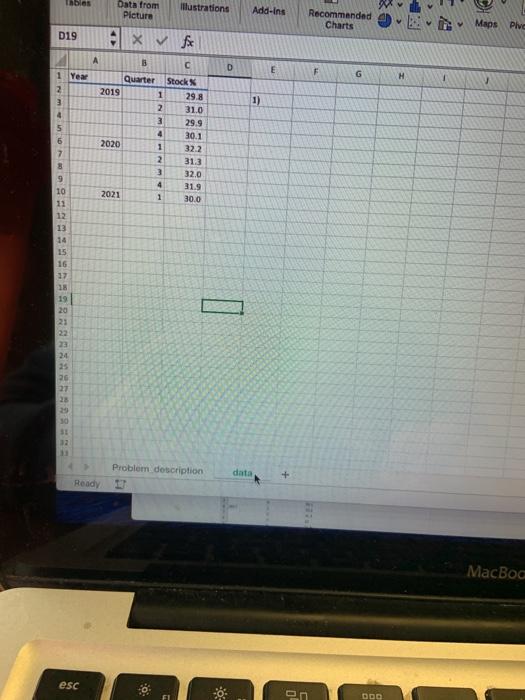
L 3 D E G H The data sheet shows the percentage of stocks in a portfolio for nine quarters from 2019 to 2021. Use the data to complete the following tasks: 1. Construct a time series plot (line chart) - display your name in the title. What type of pattern exists in the data? 2. Develop an exponential smoothing forecast for alpha.2. Use formulas, do not use the Data Analysis, Exponential Smoothing add-in. 3. Develop a 3- period moving average forecast and show on a line chart the actual and forecasted percentages. Use the "AVERAGE built-in function to calculate the 3-period moving average (do not use the Data Analysis, Moving Average add-in). Display your first and last name in the title of the chart. 4. Calculate MSE for the forecast based on exponential smoothing with alpha 4.2 as well as the MSE for the moving average forecast. Would you recommend forecast for the next quarter of 2021 based on 3-period moving average or exponential smoothing with alpha - 2? Explain. 5. What is the forecast of the percentage of stocks in a typical portfolio for the second quarter of 2021 for the method that your are recommending in te 6. On a separate sheet that you should rename as BEST ALPHA use Solver to find the value of smoothing constant alpha that would minimise sum of errors squared. Generate Solver's Answer Report Tables Data from Pictura illustrations Add-ins Recommended Charts Maps Plve D19 ox fx A B D E F G H 1 Year 2 3 1) 4 5 6 7 Quarter Stocks 2019 1 29.8 2 31.0 3 29.9 4 30.1 2020 1 322 2 313 3 32.0 4 31.9 2021 30.0 NMM 9 10 11 12 13 14 16 17 19 20 22 23 24 25 26 27 28 29 32 Problem description data + Ready MacBoa esc 0 on ODO L 3 D E G H The data sheet shows the percentage of stocks in a portfolio for nine quarters from 2019 to 2021. Use the data to complete the following tasks: 1. Construct a time series plot (line chart) - display your name in the title. What type of pattern exists in the data? 2. Develop an exponential smoothing forecast for alpha.2. Use formulas, do not use the Data Analysis, Exponential Smoothing add-in. 3. Develop a 3- period moving average forecast and show on a line chart the actual and forecasted percentages. Use the "AVERAGE built-in function to calculate the 3-period moving average (do not use the Data Analysis, Moving Average add-in). Display your first and last name in the title of the chart. 4. Calculate MSE for the forecast based on exponential smoothing with alpha 4.2 as well as the MSE for the moving average forecast. Would you recommend forecast for the next quarter of 2021 based on 3-period moving average or exponential smoothing with alpha - 2? Explain. 5. What is the forecast of the percentage of stocks in a typical portfolio for the second quarter of 2021 for the method that your are recommending in te 6. On a separate sheet that you should rename as BEST ALPHA use Solver to find the value of smoothing constant alpha that would minimise sum of errors squared. Generate Solver's Answer Report Tables Data from Pictura illustrations Add-ins Recommended Charts Maps Plve D19 ox fx A B D E F G H 1 Year 2 3 1) 4 5 6 7 Quarter Stocks 2019 1 29.8 2 31.0 3 29.9 4 30.1 2020 1 322 2 313 3 32.0 4 31.9 2021 30.0 NMM 9 10 11 12 13 14 16 17 19 20 22 23 24 25 26 27 28 29 32 Problem description data + Ready MacBoa esc 0 on ODO