

Answered step by step
Verified Expert Solution
Question
1 Approved Answer
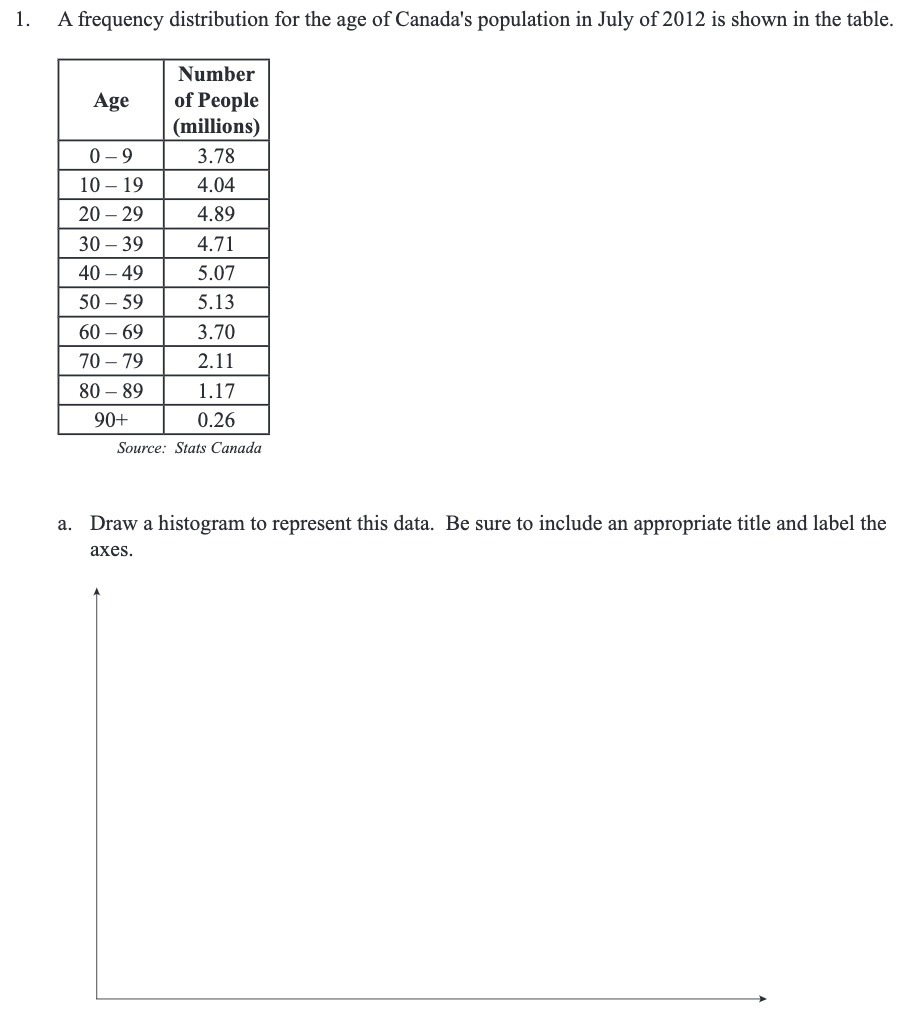
l. A frequency distribution for the age of Canada's population in July of 2012 is shown in the table. Number of People (millions) 3.78 4.04
Step by Step Solution
There are 3 Steps involved in it
Step: 1

Get Instant Access to Expert-Tailored Solutions
See step-by-step solutions with expert insights and AI powered tools for academic success
Step: 2

Step: 3
Ace Your Homework with AI
Get the answers you need in no time with our AI-driven, step-by-step assistance
Get Started
Precalculus
Authors: Michael Sullivan
9th edition
321716835, 321716833, 978-0321716835