Answered step by step
Verified Expert Solution
Question
1 Approved Answer
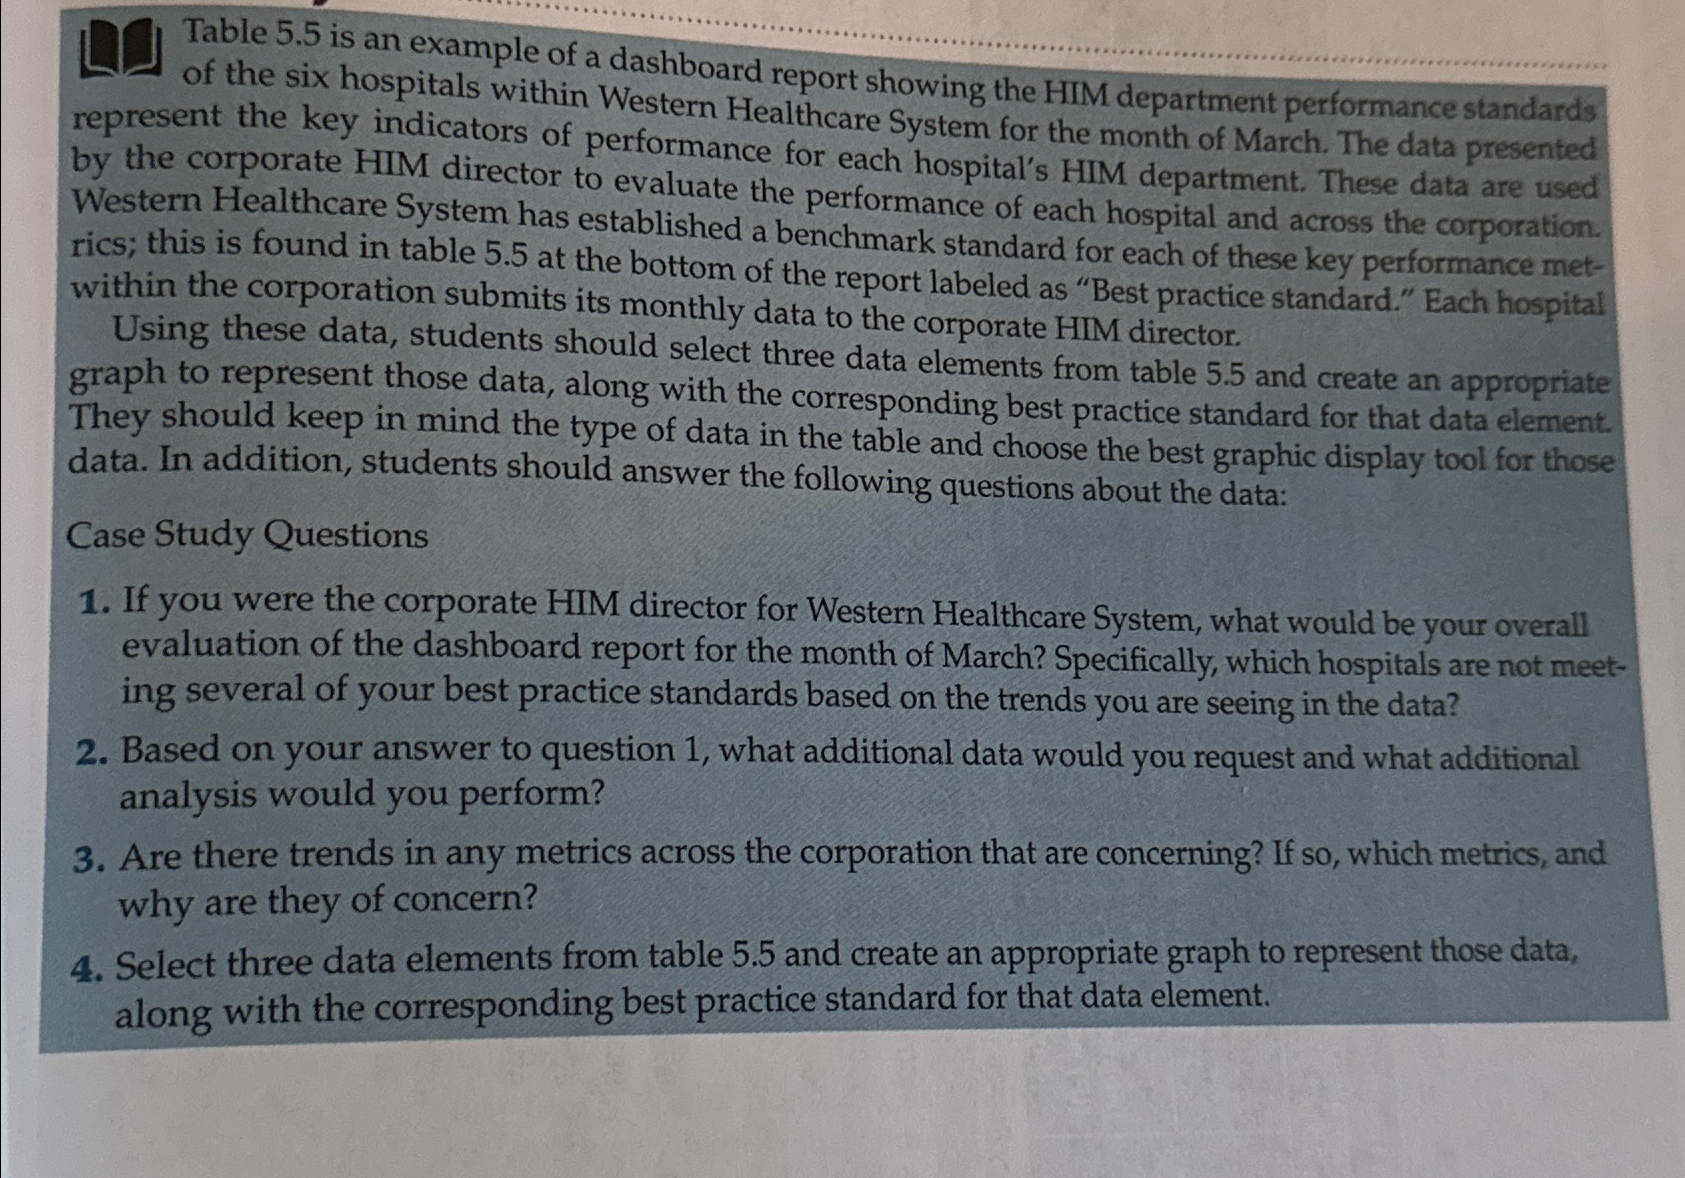
[ L ] Table 5 . 5 is an example of a dashboard report showing the HIM department performance standards of the six hospitals within
L
Table is an example of a dashboard report showing the HIM department performance standards of the six hospitals within Western Healthcare System for the month of March. The data presented represent the key indicators of performance for each hospital's HIM department. These data are used by the corporate HIM director to evaluate the performance of each hospital and across the corporation. Western Healthcare System has established a benchmark standard for each of these key performance metrics; this is found in table at the bottom of the report labeled as "Best practice standard." Each hospital within the corporation submits its monthly data to the corporate HIM director.
Using these data, students should select three data elements from table and create an appropriate graph to represent those data, along with the corresponding best practice standard for that data element. They should keep in mind the type of data in the table and choose the best graphic display tool for those data. In addition, students should answer the following questions about the data:
Case Study Questions
If you were the corporate HIM director for Western Healthcare System, what would be your overall evaluation of the dashboard report for the month of March? Specifically, which hospitals are not meeting several of your best practice standards based on the trends you are seeing in the data?
Based on your answer to question what additional data would you request and what additional analysis would you perform?
Are there trends in any metrics across the corporation that are concerning? If so which metrics, and why are they of concern?
Select three data elements from table and create an appropriate graph to represent those data, along with the corresponding best practice standard for that data element.

Step by Step Solution
There are 3 Steps involved in it
Step: 1

Get Instant Access to Expert-Tailored Solutions
See step-by-step solutions with expert insights and AI powered tools for academic success
Step: 2

Step: 3

Ace Your Homework with AI
Get the answers you need in no time with our AI-driven, step-by-step assistance
Get Started


