

Answered step by step
Verified Expert Solution
Question
1 Approved Answer
l The table below shows the levels of real GDP and potential GDP for an economy. Which year(s) is the business cycle at a peak?
l 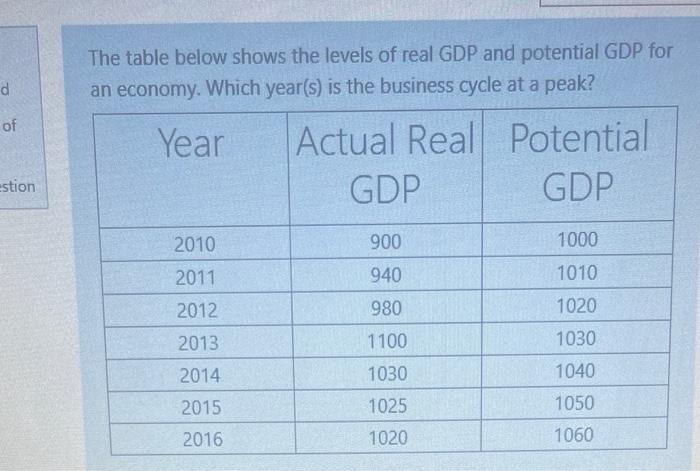
The table below shows the levels of real GDP and potential GDP for an economy. Which year(s) is the business cycle at a peak? d of Year Actual Real Potential GDP GDP estion 2010 900 1000 2011 940 1010 2012 980 1020 2013 1100 1030 2014 1030 1040 2015 1025 1050 2016 1020 1060 Step by Step Solution
There are 3 Steps involved in it
Step: 1

Get Instant Access to Expert-Tailored Solutions
See step-by-step solutions with expert insights and AI powered tools for academic success
Step: 2

Step: 3
Ace Your Homework with AI
Get the answers you need in no time with our AI-driven, step-by-step assistance
Get Started
A Fast And Frugal Finance
Authors: William P. Forbes, Aloysius Igboekwu, Shabnam Mousavi
1st Edition
0128124954, 978-0128124956