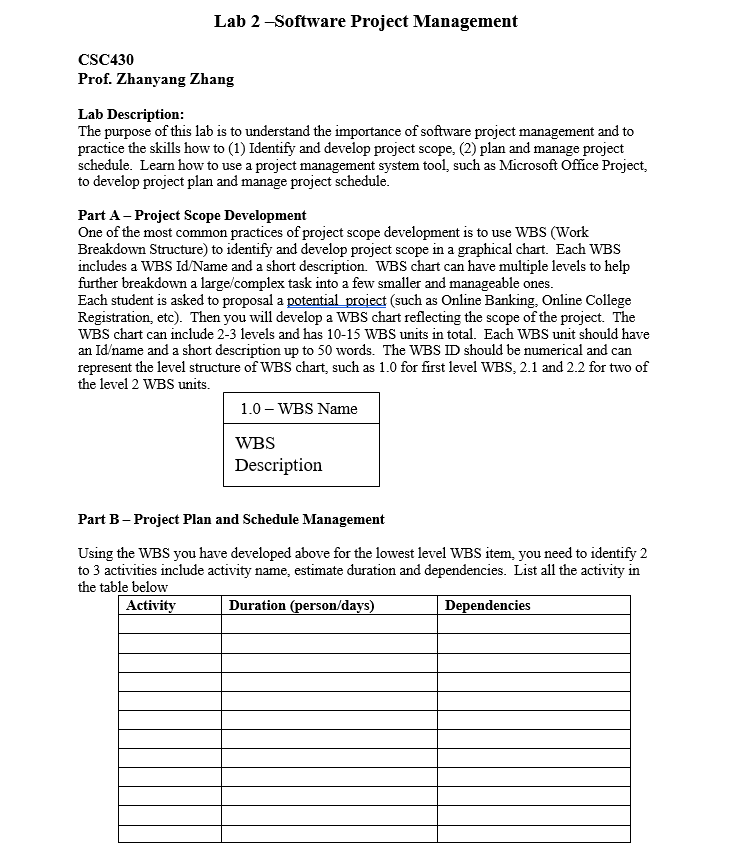
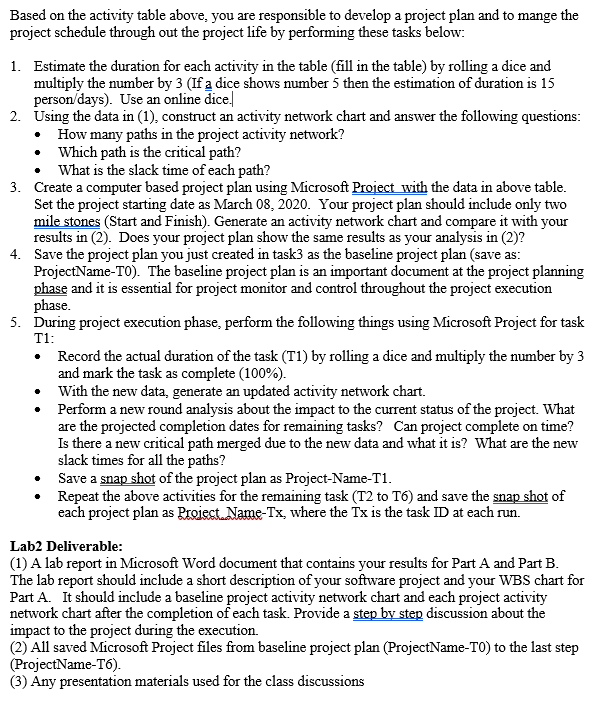
Lab 2 -Software Project Management CSC430 Prof. Zhanyang Zhang Lab Description: The purpose of this lab is to understand the importance of software project management and to practice the skills how to (1) Identify and develop project scope, (2) plan and manage project schedule. Learn how to use a project management system tool, such as Microsoft Office Project, to develop project plan and manage project schedule. Part A - Project Scope Development One of the most common practices of project scope development is to use WBS (Work Breakdown Structure) to identify and develop project scope in a graphical chart. Each WBS includes a WBS Id/Name and a short description WBS chart can have multiple levels to help further breakdown a large complex task into a few smaller and manageable ones. Each student is asked to proposal a potential project (such as Online Banking, Online College Registration, etc). Then you will develop a WBS chart reflecting the scope of the project. The WBS chart can include 2-3 levels and has 10-15 WBS units in total. Each WBS unit should have an Idame and a short description up to 50 words. The WBS ID should be numerical and can represent the level structure of WBS chart, such as 1.0 for first level WBS, 2.1 and 2.2 for two of the level 2 WBS units. 1.0-WBS Name WBS Description Part B - Project Plan and Schedule Management Using the WBS you have developed above for the lowest level WBS item, you need to identify 2 to 3 activities include activity name, estimate duration and dependencies. List all the activity in the table below Activity Duration (person/days) Dependencies Based on the activity table above, you are responsible to develop a project plan and to mange the project schedule through out the project life by performing these tasks below: 1. Estimate the duration for each activity in the table (fill in the table) by rolling a dice and multiply the number by 3 (If a dice shows number 5 then the estimation of duration is 15 person/days). Use an online dice. 2. Using the data in (1), construct an activity network chart and answer the following questions: How many paths in the project activity network? Which path is the critical path? What is the slack time of each path? 3. Create a computer based project plan using Microsoft Project with the data in above table. Set the project starting date as March 08, 2020. Your project plan should include only two mile stones (Start and Finish). Generate an activity network chart and compare it with your results in (2). Does your project plan show the same results as your analysis in (2) 4. Save the project plan you just created in task3 as the baseline project plan (save as: ProjectName-TO). The baseline project plan is an important document at the project planning phase and it is essential for project monitor and control throughout the project execution phase. 5. During project execution phase, perform the following things using Microsoft Project for task T1: Record the actual duration of the task (T1) by rolling a dice and multiply the number by 3 and mark the task as complete (100%). With the new data, generate an updated activity network chart. Perform a new round analysis about the impact to the current status of the project. What are the projected completion dates for remaining tasks? Can project complete on time? Is there a new critical path merged due to the new data and what it is? What are the new slack times for all the paths? Save a snap shot of the project plan as Project-Name-Ti. Repeat the above activities for the remaining task (T2 to T6) and save the snap shot of each project plan as Project. Name-Tx, where the Tx is the task ID at each run. Lab2 Deliverable: (1) A lab report in Microsoft Word document that contains your results for Part A and Part B. The lab report should include a short description of your software project and your WBS chart for Part A. It should include a baseline project activity network chart and each project activity network chart after the completion of each task. Provide a step by step discussion about the impact to the project during the execution. (2) All saved Microsoft Project files from baseline project plan (ProjectName-TO) to the last step (ProjectName-T6). (3) Any presentation materials used for the class discussions Lab 2 -Software Project Management CSC430 Prof. Zhanyang Zhang Lab Description: The purpose of this lab is to understand the importance of software project management and to practice the skills how to (1) Identify and develop project scope, (2) plan and manage project schedule. Learn how to use a project management system tool, such as Microsoft Office Project, to develop project plan and manage project schedule. Part A - Project Scope Development One of the most common practices of project scope development is to use WBS (Work Breakdown Structure) to identify and develop project scope in a graphical chart. Each WBS includes a WBS Id/Name and a short description WBS chart can have multiple levels to help further breakdown a large complex task into a few smaller and manageable ones. Each student is asked to proposal a potential project (such as Online Banking, Online College Registration, etc). Then you will develop a WBS chart reflecting the scope of the project. The WBS chart can include 2-3 levels and has 10-15 WBS units in total. Each WBS unit should have an Idame and a short description up to 50 words. The WBS ID should be numerical and can represent the level structure of WBS chart, such as 1.0 for first level WBS, 2.1 and 2.2 for two of the level 2 WBS units. 1.0-WBS Name WBS Description Part B - Project Plan and Schedule Management Using the WBS you have developed above for the lowest level WBS item, you need to identify 2 to 3 activities include activity name, estimate duration and dependencies. List all the activity in the table below Activity Duration (person/days) Dependencies Based on the activity table above, you are responsible to develop a project plan and to mange the project schedule through out the project life by performing these tasks below: 1. Estimate the duration for each activity in the table (fill in the table) by rolling a dice and multiply the number by 3 (If a dice shows number 5 then the estimation of duration is 15 person/days). Use an online dice. 2. Using the data in (1), construct an activity network chart and answer the following questions: How many paths in the project activity network? Which path is the critical path? What is the slack time of each path? 3. Create a computer based project plan using Microsoft Project with the data in above table. Set the project starting date as March 08, 2020. Your project plan should include only two mile stones (Start and Finish). Generate an activity network chart and compare it with your results in (2). Does your project plan show the same results as your analysis in (2) 4. Save the project plan you just created in task3 as the baseline project plan (save as: ProjectName-TO). The baseline project plan is an important document at the project planning phase and it is essential for project monitor and control throughout the project execution phase. 5. During project execution phase, perform the following things using Microsoft Project for task T1: Record the actual duration of the task (T1) by rolling a dice and multiply the number by 3 and mark the task as complete (100%). With the new data, generate an updated activity network chart. Perform a new round analysis about the impact to the current status of the project. What are the projected completion dates for remaining tasks? Can project complete on time? Is there a new critical path merged due to the new data and what it is? What are the new slack times for all the paths? Save a snap shot of the project plan as Project-Name-Ti. Repeat the above activities for the remaining task (T2 to T6) and save the snap shot of each project plan as Project. Name-Tx, where the Tx is the task ID at each run. Lab2 Deliverable: (1) A lab report in Microsoft Word document that contains your results for Part A and Part B. The lab report should include a short description of your software project and your WBS chart for Part A. It should include a baseline project activity network chart and each project activity network chart after the completion of each task. Provide a step by step discussion about the impact to the project during the execution. (2) All saved Microsoft Project files from baseline project plan (ProjectName-TO) to the last step (ProjectName-T6). (3) Any presentation materials used for the class discussions