Lab 2.1.2a Data Summarization Practice Introduction Quantitative Data Analysis provides a means for using statistics and numbers to attempt to explain what is observed. It
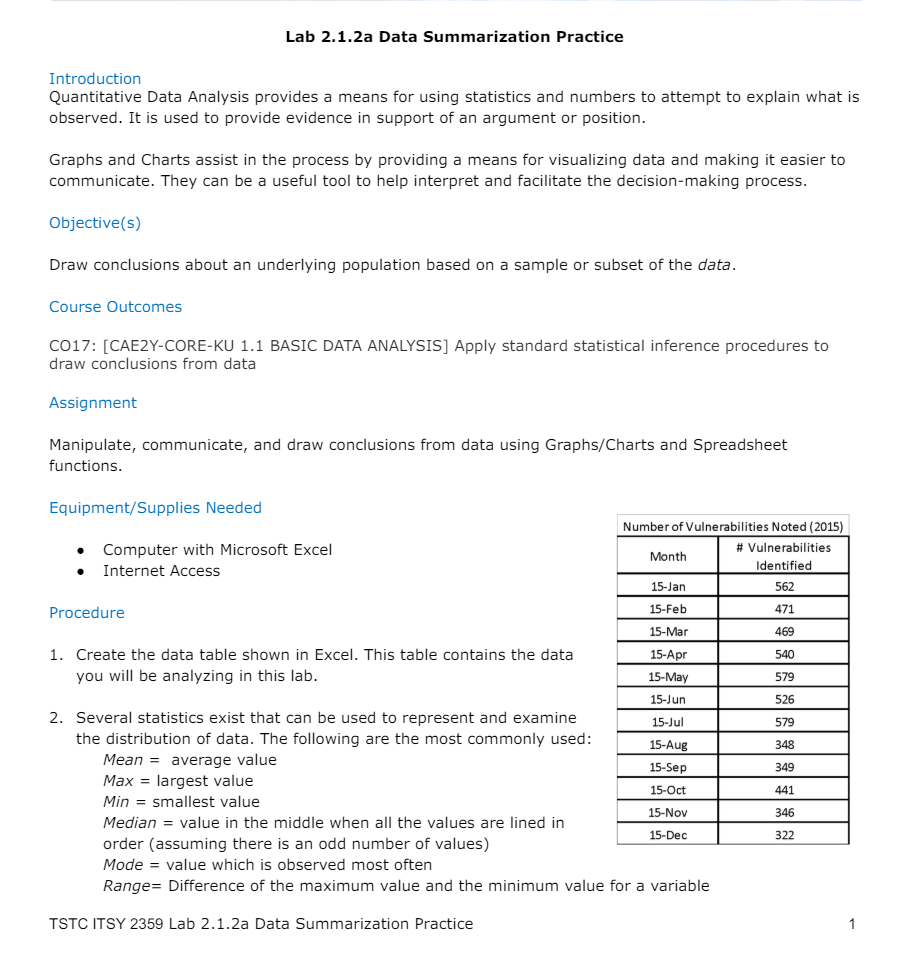
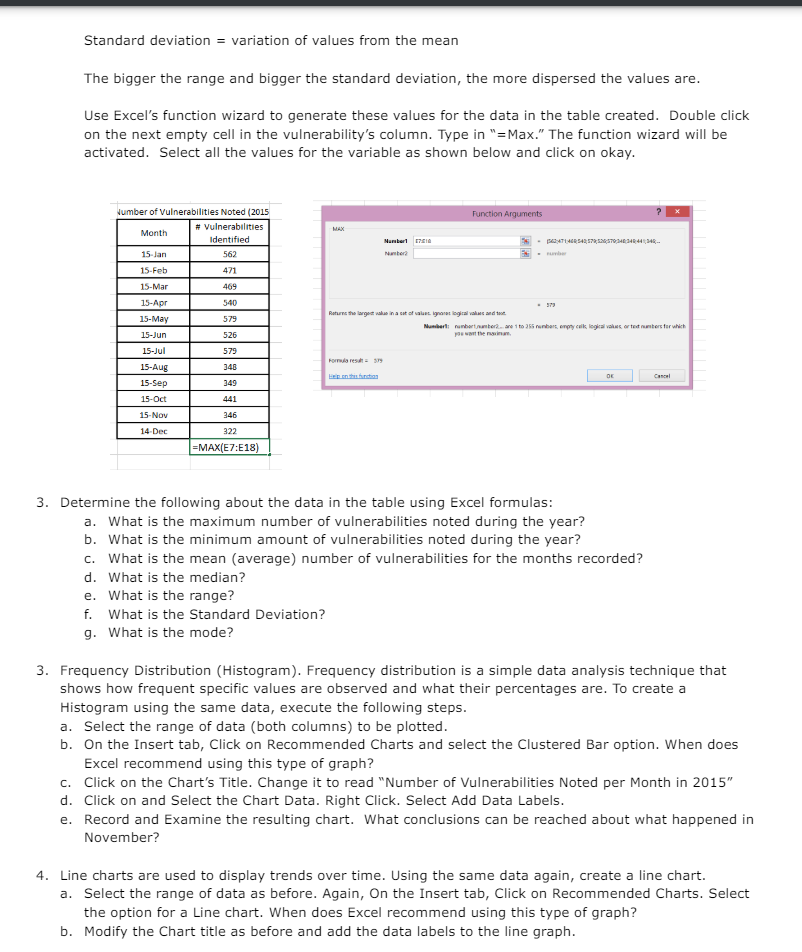
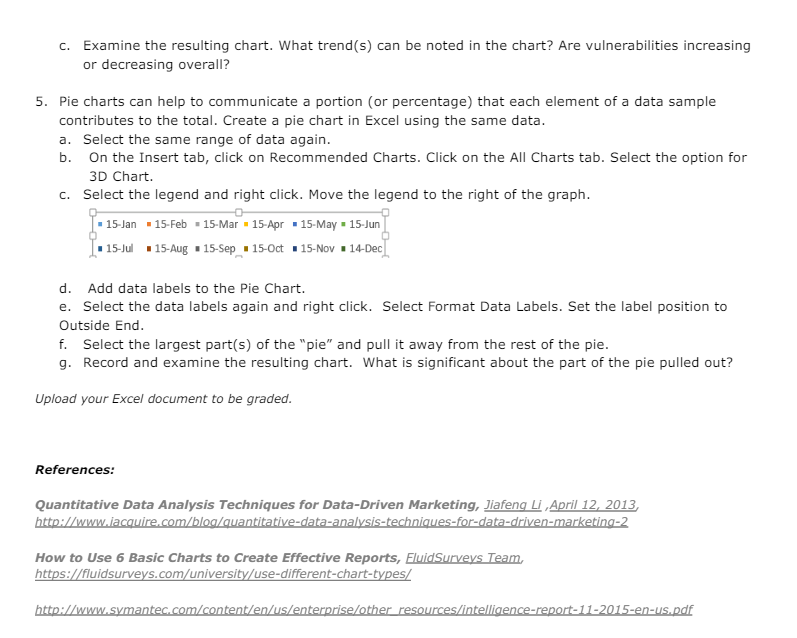
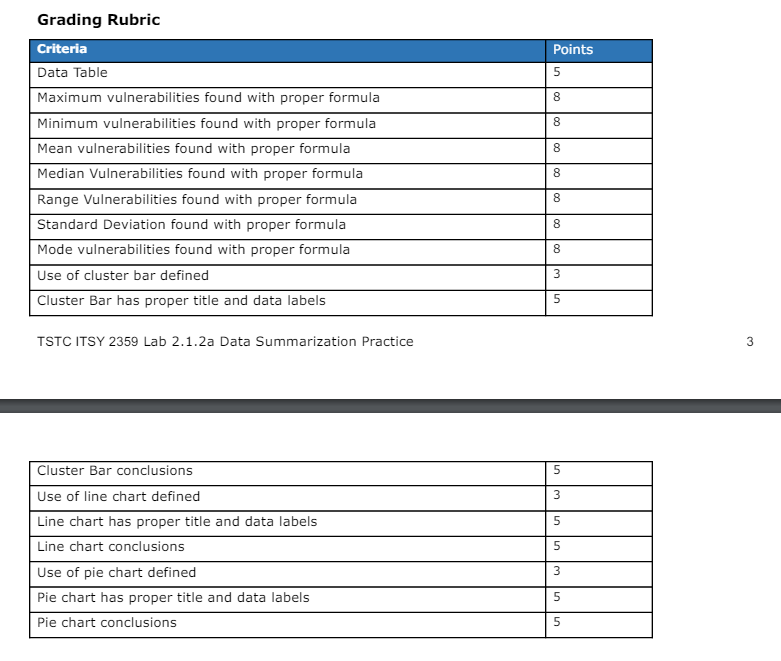
Lab 2.1.2a Data Summarization Practice Introduction Quantitative Data Analysis provides a means for using statistics and numbers to attempt to explain what is observed. It is used to provide evidence in support of an argument or position. Graphs and Charts assist in the process by providing a means for visualizing data and making it easier to communicate. They can be a useful tool to help interpret and facilitate the decision-making process. Objective(s) Draw conclusions about an underlying population based on a sample or subset of the data. Course Qutcomes CO17: [CAE2Y-CORE-KU 1.1 BASIC DATA ANALYSIS] Apply standard statistical inference procedures to draw conclusions from data Assignment Manipulate, communicate, and draw conclusions from data using Graphs/Charts and Spreadsheet functions. Equipment/Supplies Needed Mumber of Vulnerabilities Noted (2015) Computer with Microsoft Excel # Vulnerabilities s Internet Access Identified Procedure 1. Create the data table shown in Excel. This table contains the data you will be analyzing in this lab. 2. Several statistics exist that can be used to represent and examine the distribution of data. The following are the most commonly used: Mean = average value Max = largest value Min = smallest value Median = value in the middle when all the values are lined in order (assuming there is an odd number of values) Mode = wvalue which is observed most often Range= Difference of the maximum value and the minimum value for a variable TSTC ITSY 2359 Lab 2.1.2a Data Summarization Practice 1 Standard deviation = variation of values from the mean The bigger the range and bigger the standard deviation, the more dispersed the values are. Use Excel's function wizard to generate these values for the data in the table created. Double click on the next empty cell in the vulnerability's column. Type in "=Max.\" The function wizard will be activated. Select all the values for the variable as shown below and click on okay. Aumber of Vulnerabilities Moted (2015 # wulnerabilimes Identified W - AT AR ST IO R | G - s - m Fustuume e langoes wakus in 3 k of walsne. ignarst iogisl wakaee ed dses. e bt bod . 3 1 06 355 Rt sapny R, RgiE vEREE o (ot b 18 ahich a8 ! e ra . =MAX(ET:E18) | 3. Determine the following about the data in the table using Excel formulas: a. What is the maximum number of vulnerabilities noted during the year? What is the minimum amount of vulnerabilities noted during the year? What is the mean (average) number of vulnerabilities for the months recorded? What is the median? What is the range? What is the Standard Deviation? What is the mode? Q thom oo N oo 3. Frequency Distribution (Histogram). Frequency distribution is a simple data analysis technique that shows how frequent specific values are observed and what their percentages are. To create a Histogram using the same data, execute the following steps. a. b. oon b. Select the range of data (both columns) to be plotted. On the Insert tab, Click on Recommended Charts and select the Clustered Bar option. When does Excel recommend using this type of graph? Click on the Chart's Title. Change it to read "Mumber of Vulnerabilities Noted per Month in 2015" Click on and Select the Chart Data. Right Click. Select Add Data Labels. Record and Examine the resulting chart. What conclusions can be reached about what happened in November? Line charts are used to display trends over time. Using the same data again, create a line chart. a. Select the range of data as before. Again, On the Insert tab, Click on Recommended Charts. Select the option for a Line chart. When does Excel recommend using this type of graph? Modify the Chart title as before and add the data labels to the line graph. c. Examine the resulting chart. What trend(s) can be noted in the chart? Are vulnerabilities increasing or decreasing overall? 5. Pie charts can help to communicate a portion (or percentage) that each element of a data sample contributes to the total. Create a pie chart in Excel using the same data. a. Select the same range of data again. b. On the Insert tab, click on Recommended Charts. Click on the All Charts tab. Select the option for 3D Chart. c. Select the legend and right click. Move the legend to the right of the graph. 15-Jan . 15-Feb . 15-Mar . 15-Apr = 15-May = 15-Jun 15-Jul = 15-Aug . 15-Sep 15-Oct . 15-Nov . 14-Dec d. Add data labels to the Pie Chart. e. Select the data labels again and right click. Select Format Data Labels. Set the label position to Outside End. f. Select the largest part(s) of the "pie" and pull it away from the rest of the pie. g. Record and examine the resulting chart. What is significant about the part of the pie pulled out? Upload your Excel document to be graded. References: Quantitative Data Analysis Techniques for Data-Driven Marketing, Jiafeng Li ,April 12, 2013, http://www.lacquire.com/blog/quantitative-data-analysis-techniques-for-data-driven-marketing-2 How to Use 6 Basic Charts to Create Effective Reports, FluidSurveys Team, https://fluidsurveys.com/university/use-different-chart-types/ http://www.symantec.com/content/en/us/enterprise/other_resources/intelligence-report-11-2015-en-us.pdfGrading Rubric Data Table Maximum vulnerabilities found with proper formula Minimum wvulnerabilities found with proper formula Mean vulnerabilities found with proper formula Median Yulnerabilities found with proper formula Range Vulnerabilities found with proper formula Standard Deviation found with proper formula Mode vulnerabilities found with proper formula Use of cluster bar defined Cluster Bar has proper title and data labels TSTC ITSY 2359 Lab 2.1.2a Data Summarization Practice 3 Cluster Bar conclusions Use of line chart defined Line chart has proper title and data labels Line chart conclusions Use of pie chart defined Pie chart has proper title and data labels Pie chart conclusions
Step by Step Solution
There are 3 Steps involved in it
Step: 1
Get Instant Access to Expert-Tailored Solutions
See step-by-step solutions with expert insights and AI powered tools for academic success
Step: 2
Step: 3
Ace Your Homework with AI
Get the answers you need in no time with our AI-driven, step-by-step assistance