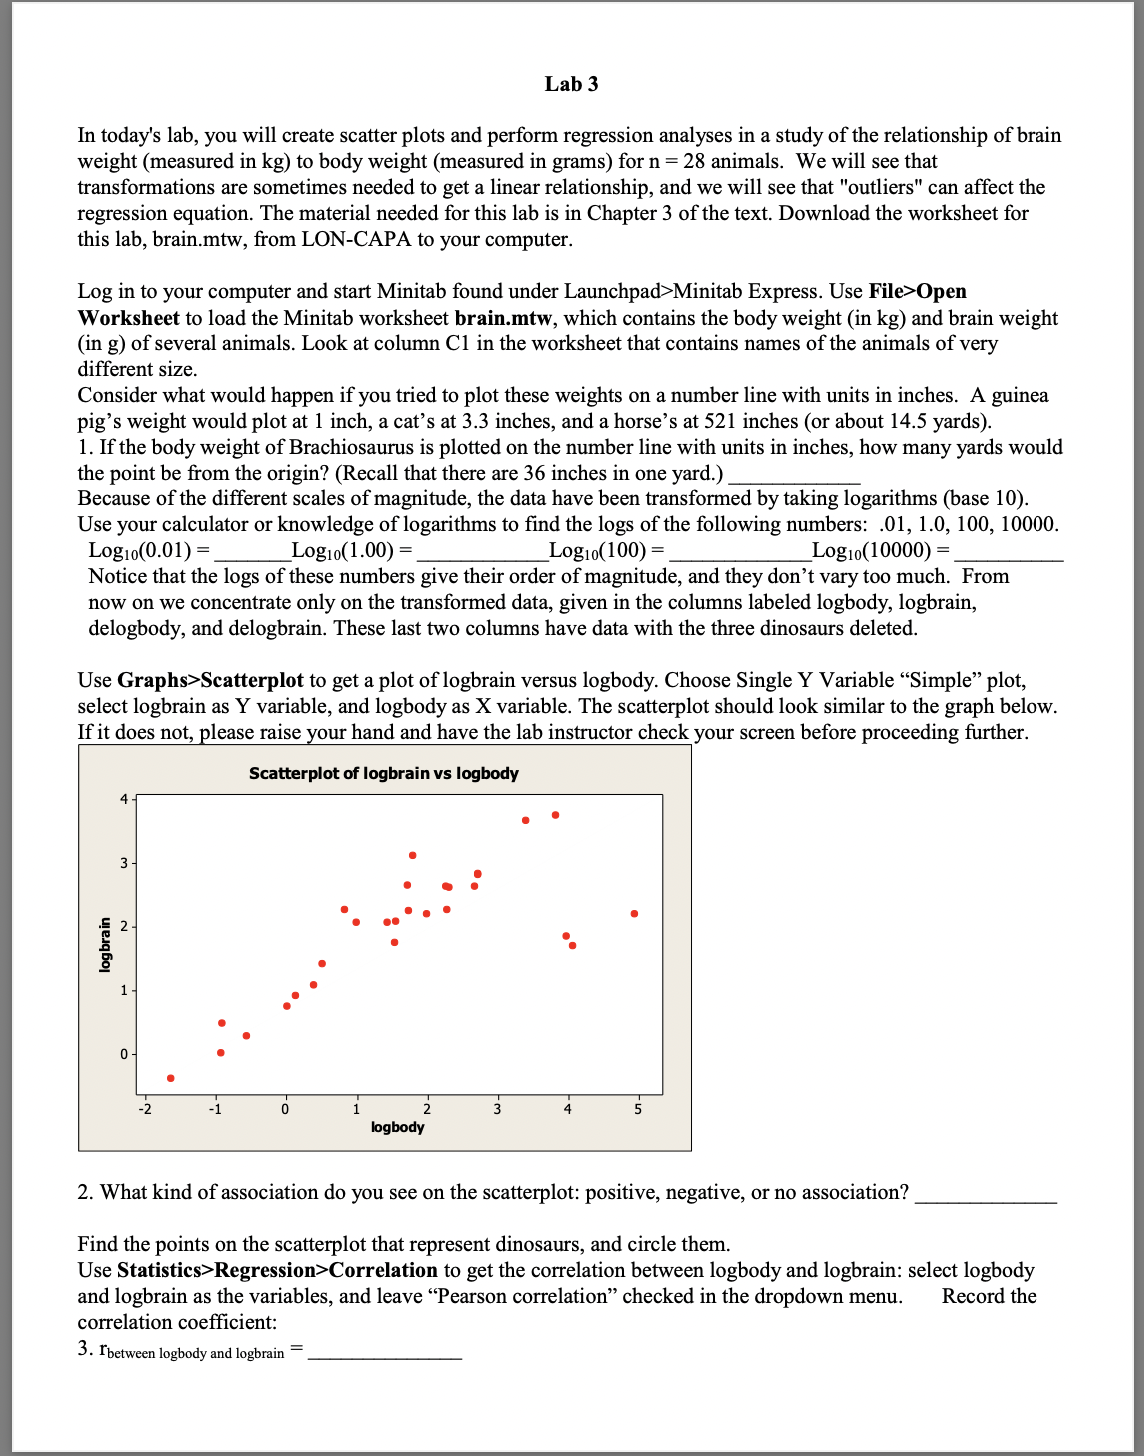
Lab 3 In today's lab, you will create scatter plots and perform regression analyses in a study of the relationship of brain weight (measured in kg) to body weight (measured in grams) for n = 28 animals. We will see that transformations are sometimes needed to get a linear relationship, and we will see that "outliers" can affect the regression equation. The material needed for this lab is in Chapter 3 of the text. Download the worksheet for this lab, brain.mtw, from LON-CAPA to your computer. Log in to your computer and start Minitab found under Launchpad>Minitab Express. Use File>0pen Worksheet to load the Minitab worksheet brain.mtw, which contains the body weight (in kg) and brain weight (in g) of several animals. Look at column C1 in the worksheet that contains names of the animals of very different size. Consider what w0uld happen if you tried to plot these weights on a number line with units in inches. A guinea pig's weight would plot at 1 inch, a cat's at 3.3 inches, and a horse's at 521 inches (or about 14.5 yards). 1. Ifthe body weight of Brachiosaurus is plotted on the number line with units in inches, how many yards would the point be -om the origin? (Recall that there are 36 inches in one yard.) Because of the different scales of magnitude, the data have been transformed by taking logarithms (base 10). Use your calculator or knowledge of logarithms to nd the logs of the following numbers: .01, 1.0, 100, 10000. Log10(0-01) = Logm(1.00) = L0g1u(100)= LOgm(10000)= Notice that the logs of these numbers give their order of magnitude, and they don't vary too much. From now on we concentrate only on the transformed data, given in the columns labeled logbody, logbrain, delogbody, and delogbrain. These last two columns have data with the three dinosaurs deleted. Use Graphs>Scatterplot to get a plot of logbrain versus logbody. Choose Single Y Variable \"Simple\" plot, select logbrain as Y variable, and logbody as X variable. The scatterplot should look similar to the graph below. If it does not, please raise your hand and have the lab instructor check your screen before proceeding further. Smtbrplot of logbrain vs logbody 2. What kind of association do you see on the scatterplot: positive, negative, or no association? Find the points on the scatterplot that represent dinosaurs, and circle them. Use Statistics>Regression>Correlation to get the correlation between logbody and logbrain: select logbody and logbrain as the variables, and leave \"Pearson correlation\" checked in the dropdown menu. Record the correlation coefficient: 3 - rhetween logbody and logbrain = Use Statistics>Regression>Simple Regression to nd the regression equation for logbrain variable (response variable y) vs logbody (predictor variable x). Leave \"Linear\" checked under \"Type of regression model." 4. What is the slope of the regression line reported by Minitab? (Scroll through the output to Regression Equation part). Use Statistics>Summary Statistics>Desc1iptive Statistics to get the descriptive statistics of logbody and logbrain. Select \"Data are in more than one column\" from the dropdown menu. Recall that logbody is the )1- variable and logbrain is the y-variable. Record their means below: 5. f 6. y = Plot the point (x, y) on the scatter plot (this 15 not one of the data points displayed since the means are not of logbody and logbrain do necessarily correspond to one particular animal). Use the regression equation reported by Minitab, and plug in the value of f as logbody value in the equation. 7. The resulting value of y (logbrain) is . Is your answer to #7 the same as answer to #6, up to rounding error? Since the coordinates of the point (i , J7) satisfy the regression equation, this point is called a pin-point or a balance point of the regression line. Draw the regression line on the scatterplot provided abOve, following these steps. First, plot the balance point (if) . To get the coordinates of another point on the line, choose an x-value and substitute that value into the regression equation and get the corresponding y-value. Write the coordinates in the table below: xV Note that the point you got does not have to be one of the data points. Plot this second point on the scatterplot, and nally, draw the line determined by these two points. This is a plot of the regression line. We will now use the regression equation to predict brain weight of animals based on their body weight. 8. For a rabbit, the value of logbody in the data column is IF 9 The actual observed value of logbrain for a rabbit 1s y= 10. Using the regression equation and plugging 1n the value of x for a rabbit into it, the predicted value of logbrain 1s y- .Round your answer to 5 decimal places 11. The error of prediction (also called residual) using logbrain versus logbody equation for a rabbit is y j? = . Round your answer to 5 decimal places. In Minitab's output for regression (use the Navigator menu on the left to change which output is displayed inside the session window), nd the table called Analysis of Variance. In this table, the row Error and Column Adj SS (Adjusted Sum of Squares) give the SSE, sum of squares of errors of prediction. This quantity, SSE, equals the sum of squares of errors of prediction for all animals in the data. In #11, you computed one of such errors, for a rabbit. 12. For the regression of logbrain versus logbody, SSE= We now repeat the regression analysis but with the three "dinosaur" points removed. The logged data with dinosaurs deleted appears in the columns, "delogbody" and "delogbrain". Use Statistics>Regression>Correlation, select delogbody and delogbrain as the variables to find the correlation between delogbody and delogbrain: 13- rhetween delogbody and deiogbrain= How does this correlation coefcient compare to the one with dinosaurs included from #3? Use Statistics>Regression>Simple Regression to nd the regression equation for delogbrain (response variable y) vs delogbgiy (predictor variable x). We will now use this equation to predict the delogbrain for a rabbit. 14. Using the regression equation of delogbrain verSus delogbody, and plugging in the value of x for a rabbit into it, the predicted value of delogbrain is j" = . Round your answer to 5 decimal places. 15. The error of prediction (also called residual) using delogbrain versus delogbody equation for a rabbit is y j' = . Round your answer to 5 decimal places. Compare your answers to #11 and #15. Which one is smaller in absolute value? 16. For the regression of delogbrain versus delogbody, SSE= Compare your answers to # 12 and #16 Which one is smaller (1. e. prediction 1s better)? To see why the error of prediction changes when dinosaurs are deleted from the data, we will use Minitab to plot both lines, with and without dinosaurs, on scatterplots. Use Graphs>Scatterplot, choose option Single Y Variable \"Simple\". Enter logbrain as Y and logbody as X and click OK. Click on the scatterplot to select it, then click on the \"+\" sign that appears beside the graph to display the \"Graph Elements\" menu. Check the box next to \"Regression Fit\" to add a regression line to the scatterplot. Following the same process, create a scatterplot for delogbrain vs. delogbody. Use Graphs>Scatterplot, choose option Single Y Variable \"Simple\". Enter delogbrain as Y and delogbody as X and click OK. Click on the scatterplot to select it, then click on the \"+\" sign that appears beside the graph to display the \"Graph Elements\" menu. Check the box next to \"Regression Fit\" to add a regression line to the scatterplot. To compare logbrain vs. logbody and delogbrain vs. delogbody scatterplots. use the \"Navigator\" menu on the left to alternate between the two outputs. 17. Which of the two regression lines (dinosaurs included or dinosaurs excluded) passes closer to most points on the scatterplot? Circle one: dinosaurs included 2' dinosaurs excluded. Information about each regression line can be found by scrolling down below the scatterplots. Find the R2 values for the two regressions. In the regression output, Minitab uses notation R-sq for R2, and it gives the percentage of variation in the yvariable that is explained by the x-variable. So the higher the R2 value, the better the x-variable is as a predictor of the y-variable for a given data set. When submitting your answers to questions 18 and 19 to LONCAPA, enter just the numbers between 0 and 100 without % symbol. 18. R2 = (dinosaurs included) 19. R2 = (dinosaurs excluded) Which R2 is larger? Does your answer agree with answer to #17? The text discusses r2 , the squared correlation coefcient. R2 reported by Minitab is simply 1'2 expressed as a percentage: R2 = 1-2 x 100%. Check this using delogbrain versus delogbody data. From #13: 20. The squared correlation coefcient for delogbrain versus delogbody r2 = Compare the number you obtained to your answer to #19