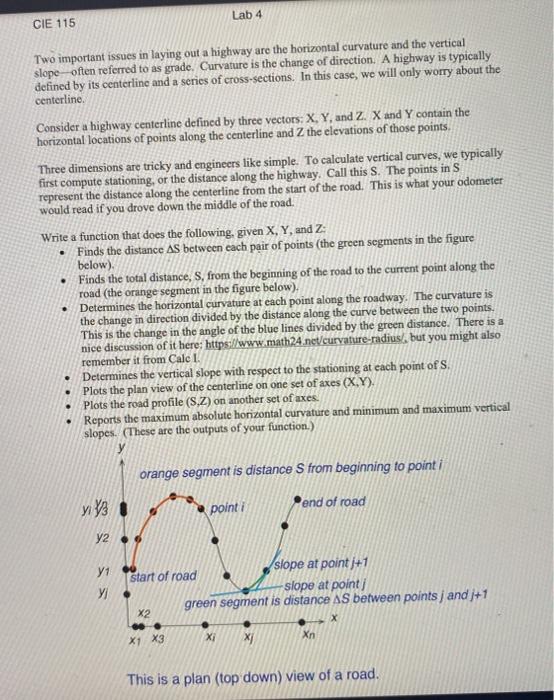
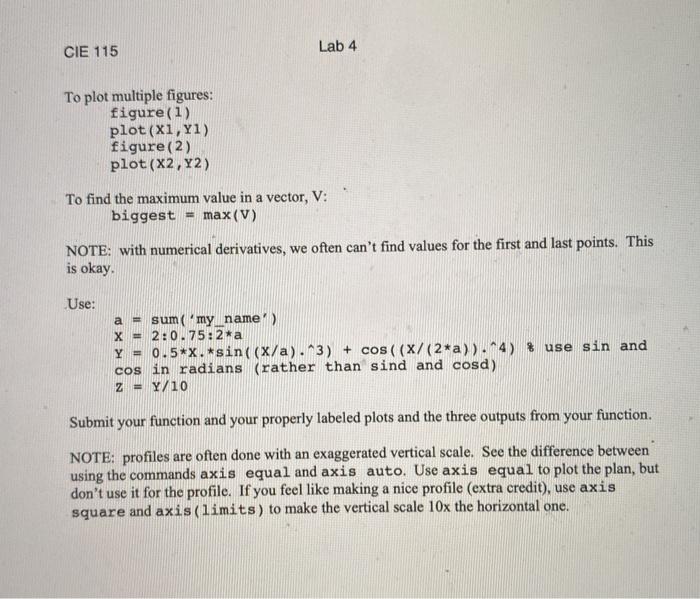
Lab 4 CIE 115 . Two important issues in laying out a highway are the horizontal curvature and the vertical slope often referred to as grade. Curvature is the change of direction. A highway is typically defined by its centerline and a series of cross-sections. In this case, we will only worry about the centerline. Consider a highway centerline defined by three vectors: X, Y, and 2. X and Y contain the horizontal locations of points along the centerline and the elevations of those points. Three dimensions are tricky and engineers like simple. To calculate vertical curves, we typically first compute stationing, or the distance along the highway. Call this S. The points in S represent the distance along the centerline from the start of the road. This is what your odometer would read if you drove down the middle of the road. Write a function that does the following. given X, Y, and Z: Finds the distance AS between each pair of points (the green segments in the figure below) Finds the total distance, S, from the beginning of the road to the current point along the road (the orange segment in the figure below) Determines the horizontal curvature at each point along the roadway. The curvature is the change in direction divided by the distance along the curve between the two points. This is the change in the angle of the blue lines divided by the green distance. There is a nice discussion of it here: https://www.math24.net/curvature-radius/, but you might also remember it from Calc I. Determines the vertical slope with respect to the stationing at each point of S. Plots the plan view of the centerline on one set of axes (X,Y), Plots the road profile (S.Z) on another set of axes. Reports the maximum absolute horizontal curvature and minimum and maximum vertical slopes. (These are the outputs of your function.) orange segment is distance S from beginning to point i yiys 1 point i end of road y2 y1 y slope at point 1+1 start of road -slope at point green segment is distance AS between points j andj+1 X2 X XI X1 X3 Xn This is a plan (top down) view of a road. CIE 115 Lab 4 To plot multiple figures: figure(1) plot(X1,Y1) figure (2) plot(x2,Y2) To find the maximum value in a vector, V: biggest = max(V) NOTE: with numerical derivatives, we often can't find values for the first and last points. This is okay. Use: a- sum('my name) X = 2:0.75:2*a Y = 0.5*X.*sin((x/a). 3) + cos((X/(2*a)). ^4) % use sin and cos in radians (rather than sind and cosd) Z - Y/10 Submit your function and your properly labeled plots and the three outputs from your function. NOTE: profiles are often done with an exaggerated vertical scale. See the difference between using the commands axis equal and axis auto. Use axis equal to plot the plan, but don't use it for the profile. If you feel like making a nice profile (extra credit), use axis square and axis (limits) to make the vertical scale 10x the horizontal one. Lab 4 CIE 115 . Two important issues in laying out a highway are the horizontal curvature and the vertical slope often referred to as grade. Curvature is the change of direction. A highway is typically defined by its centerline and a series of cross-sections. In this case, we will only worry about the centerline. Consider a highway centerline defined by three vectors: X, Y, and 2. X and Y contain the horizontal locations of points along the centerline and the elevations of those points. Three dimensions are tricky and engineers like simple. To calculate vertical curves, we typically first compute stationing, or the distance along the highway. Call this S. The points in S represent the distance along the centerline from the start of the road. This is what your odometer would read if you drove down the middle of the road. Write a function that does the following. given X, Y, and Z: Finds the distance AS between each pair of points (the green segments in the figure below) Finds the total distance, S, from the beginning of the road to the current point along the road (the orange segment in the figure below) Determines the horizontal curvature at each point along the roadway. The curvature is the change in direction divided by the distance along the curve between the two points. This is the change in the angle of the blue lines divided by the green distance. There is a nice discussion of it here: https://www.math24.net/curvature-radius/, but you might also remember it from Calc I. Determines the vertical slope with respect to the stationing at each point of S. Plots the plan view of the centerline on one set of axes (X,Y), Plots the road profile (S.Z) on another set of axes. Reports the maximum absolute horizontal curvature and minimum and maximum vertical slopes. (These are the outputs of your function.) orange segment is distance S from beginning to point i yiys 1 point i end of road y2 y1 y slope at point 1+1 start of road -slope at point green segment is distance AS between points j andj+1 X2 X XI X1 X3 Xn This is a plan (top down) view of a road. CIE 115 Lab 4 To plot multiple figures: figure(1) plot(X1,Y1) figure (2) plot(x2,Y2) To find the maximum value in a vector, V: biggest = max(V) NOTE: with numerical derivatives, we often can't find values for the first and last points. This is okay. Use: a- sum('my name) X = 2:0.75:2*a Y = 0.5*X.*sin((x/a). 3) + cos((X/(2*a)). ^4) % use sin and cos in radians (rather than sind and cosd) Z - Y/10 Submit your function and your properly labeled plots and the three outputs from your function. NOTE: profiles are often done with an exaggerated vertical scale. See the difference between using the commands axis equal and axis auto. Use axis equal to plot the plan, but don't use it for the profile. If you feel like making a nice profile (extra credit), use axis square and axis (limits) to make the vertical scale 10x the horizontal one