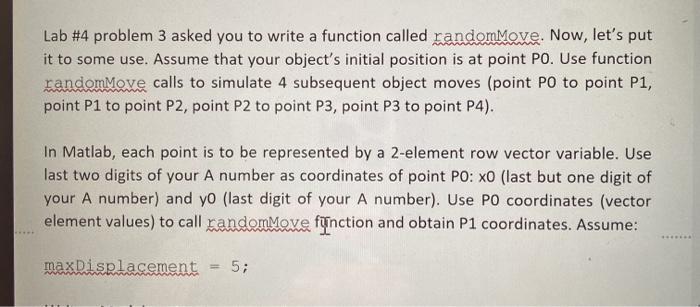
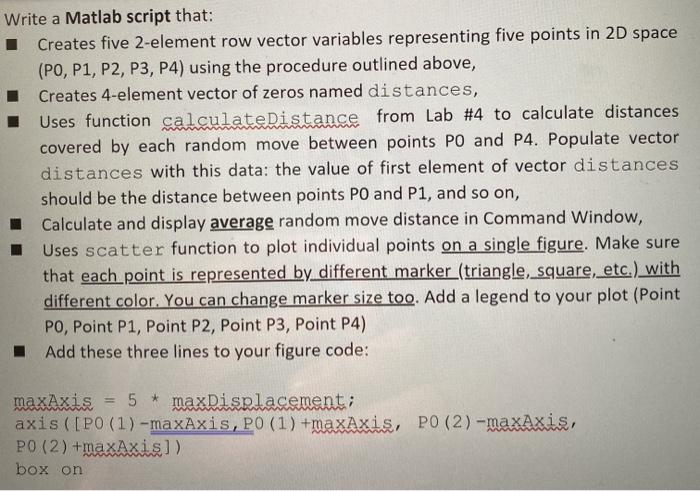
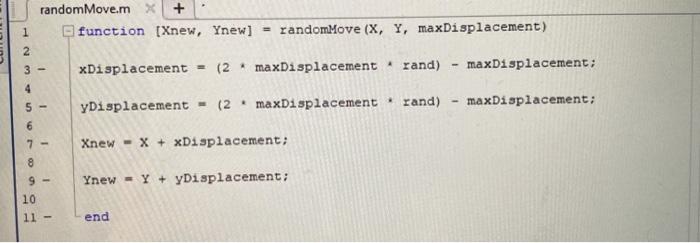
Lab #4 problem 3 asked you to write a function called randomMove. Now, let's put it to some use. Assume that your object's initial position is at point PO. Use function randomMove calls to simulate 4 subsequent object moves (point PO to point P1, point P1 to point P2, point P2 to point P3, point P3 to point P4). In Matlab, each point is to be represented by a 2-element row vector variable. Use last two digits of your A number as coordinates of point PO: XO (last but one digit of your A number) and yo (last digit of your A number). Use PO coordinates (vector element values) to call bandomMaxe fynction and obtain P1 coordinates. Assume: maxDisplacement 5; Write a Matlab script that: Creates five 2-element row vector variables representing five points in 2D space (PO, P1, P2, P3, P4) using the procedure outlined above, Creates 4-element vector of zeros named distances, Uses function calculate Distance from Lab #4 to calculate distances covered by each random move between points PO and P4. Populate vector distances with this data: the value of first element of vector distances should be the distance between points PO and P1, and so on, Calculate and display average random move distance in Command Window, Uses scatter function to plot individual points on a single figure. Make sure that each point is represented by different marker(triangle, square, etc.) with different color. You can change marker size too. Add a legend to your plot (Point PO, Point P1, Point P2, Point P3, Point P4) 1 Add these three lines to your figure code: maxAxis = 5 * maxDisplacement; axis ([PO(1)-maxAxis, PO (1) +maxAxis, PO (2) -maxAxis, PO (2) +maxAxis]) box on random Move.mx + 1 function [Xnew, Ynew] = randomMove (X, Y, maxDisplacement) 2 3 - xDisplacement = (2. maxDisplacement rand) maxDisplacement: 4 5 - yDisplacement - 12. maxDisplacement . rand) maxDisplacement; 6 7- Xnew - x + xDisplacement; 8 Ynew = Y + yDisplacement; 9 - 10 11 - end Lab #4 problem 3 asked you to write a function called randomMove. Now, let's put it to some use. Assume that your object's initial position is at point PO. Use function randomMove calls to simulate 4 subsequent object moves (point PO to point P1, point P1 to point P2, point P2 to point P3, point P3 to point P4). In Matlab, each point is to be represented by a 2-element row vector variable. Use last two digits of your A number as coordinates of point PO: XO (last but one digit of your A number) and yo (last digit of your A number). Use PO coordinates (vector element values) to call bandomMaxe fynction and obtain P1 coordinates. Assume: maxDisplacement 5; Write a Matlab script that: Creates five 2-element row vector variables representing five points in 2D space (PO, P1, P2, P3, P4) using the procedure outlined above, Creates 4-element vector of zeros named distances, Uses function calculate Distance from Lab #4 to calculate distances covered by each random move between points PO and P4. Populate vector distances with this data: the value of first element of vector distances should be the distance between points PO and P1, and so on, Calculate and display average random move distance in Command Window, Uses scatter function to plot individual points on a single figure. Make sure that each point is represented by different marker(triangle, square, etc.) with different color. You can change marker size too. Add a legend to your plot (Point PO, Point P1, Point P2, Point P3, Point P4) 1 Add these three lines to your figure code: maxAxis = 5 * maxDisplacement; axis ([PO(1)-maxAxis, PO (1) +maxAxis, PO (2) -maxAxis, PO (2) +maxAxis]) box on random Move.mx + 1 function [Xnew, Ynew] = randomMove (X, Y, maxDisplacement) 2 3 - xDisplacement = (2. maxDisplacement rand) maxDisplacement: 4 5 - yDisplacement - 12. maxDisplacement . rand) maxDisplacement; 6 7- Xnew - x + xDisplacement; 8 Ynew = Y + yDisplacement; 9 - 10 11 - end


