Answered step by step
Verified Expert Solution
Question
1 Approved Answer
LAB 5: Make sure its in python. Following Lab 5, write a program that asks the user for the name of a .png file and

LAB 5:


Make sure its in python.
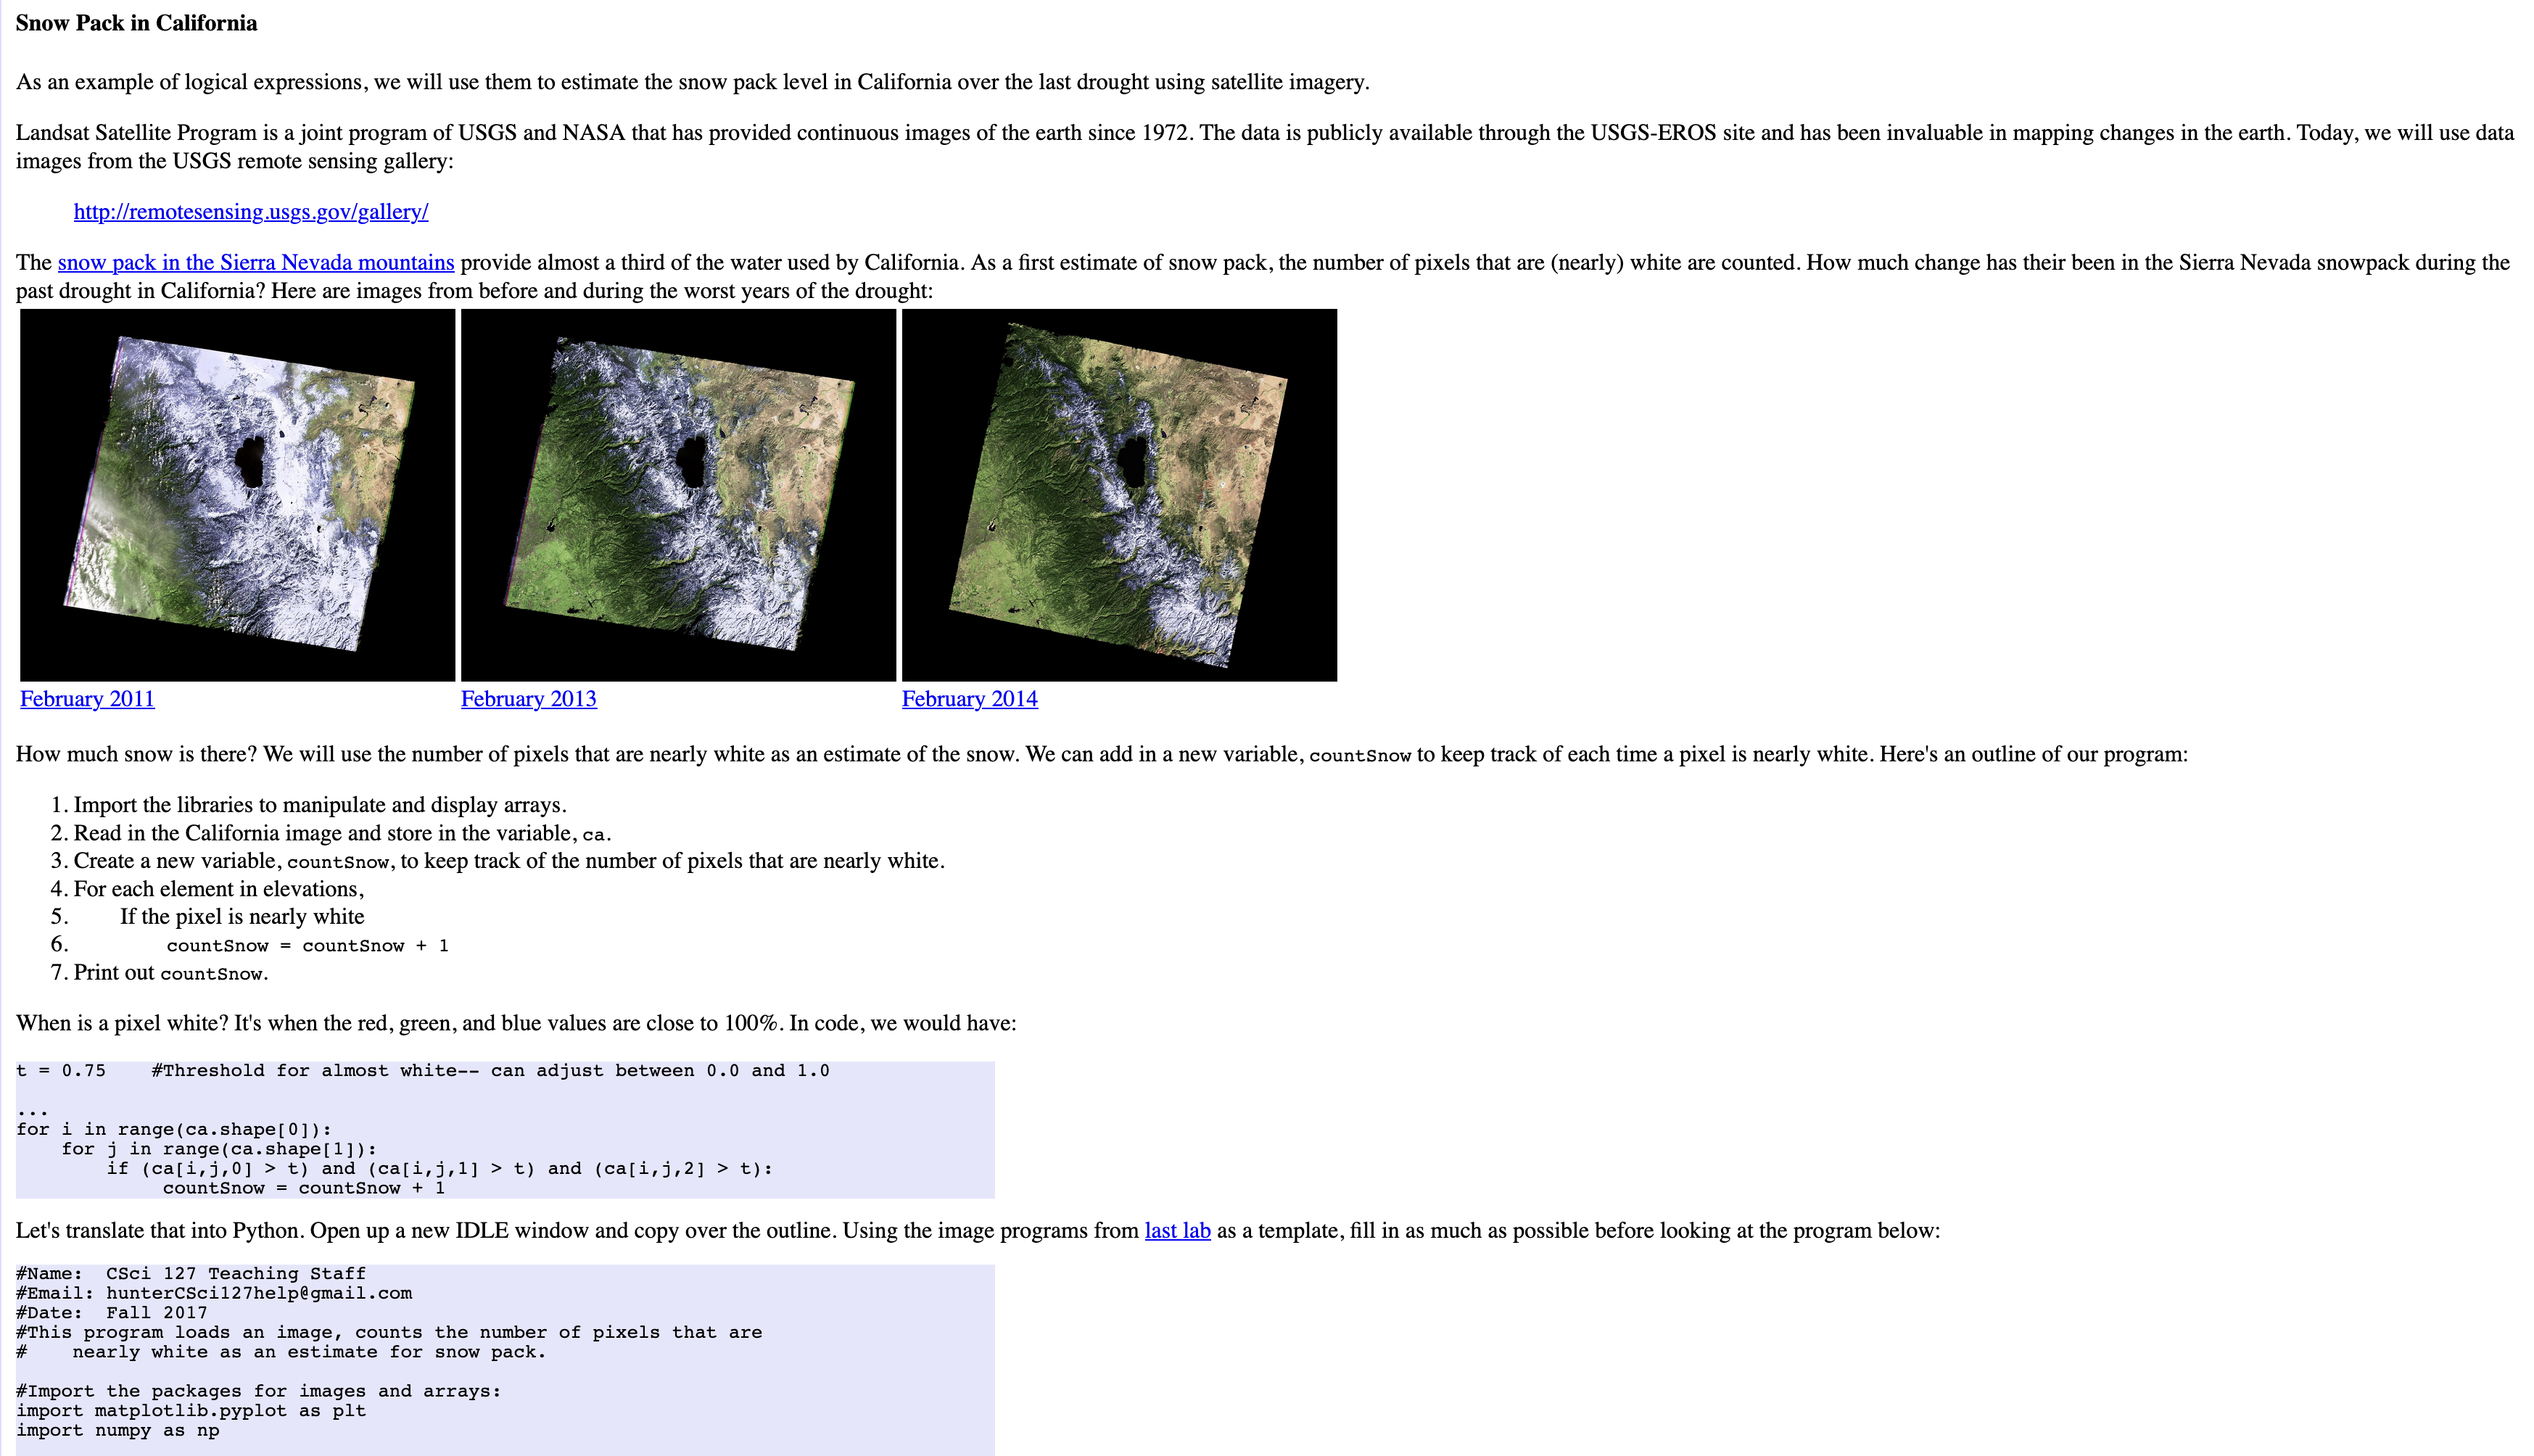
Following Lab 5, write a program that asks the user for the name of a .png file and print the number of pixels that are nearly white (the fraction of red, the fraction of green, and the fraction of blue are all above 0.8). For example, if your file was of the snow pack in the Sierra Nevada mountains in California in February 2014: then a sample run would be: Enter file name: caDrought2014.png Snow count is 38010 Snow Pack in California As an example of logical expressions, we will use them to estimate the snow pack level in California over the last drought using satellite imagery. Landsat Satellite Program is a joint program of USGS and NASA that has provided continuous images of the earth since 1972. The data is publicly available through the USGS-EROS site and has been invaluable in mapping changes in the earth. Today, we will use data images from the USGS remote sensing gallery: http://remotesensing.usgs.gov/gallery/ The snow pack in the Sierra Nevada mountains provide almost a third of the water used by California. As a first estimate of snow pack, the number of pixels that are (nearly) white are counted. How much change has their been in the Sierra Nevada snowpack during the past drought in California? Here are images from before and during the worst years of the drought: February 2011 February 2013 February 2014 How much snow is there? We will use the number of pixels that are nearly white as an estimate of the snow. We can add in a new variable, countSnow to keep track of each time a pixel is nearly white. Here's an outline of our program: 1. Import the libraries to manipulate and display arrays. 2. Read in the California image and store in the variable, ca. 3. Create a new variable, countSnow, to keep track of the number of pixels that are nearly white. 4. For each element in elevations, 5. If the pixel is nearly white 6. countSnow = countSnow + 1 7. Print out count Snow. When is a pixel white? It's when the red, green, and blue values are close to 100%. In code, we would have: t = 0.75 #Threshold for almost white-- can adjust between 0.0 and 1.0 for i in range (ca.shape[0]): for j in range (ca.shape[1]): if (ca[i,j,0] > t) and (ca[i,j,1] > t) and (ca[i,j,2] > t): countSnow = countSnow + 1 Let's translate that into Python. Open up new IDLE window and copy over the outline. Using the image programs from last lab as a template, fill in as much as possible before looking at the program below: #Name: CSci 127 Teaching Staff #Email: huntercSci127help@gmail.com #Date: Fall 2017 #This program loads an image, counts the number of pixels that are # nearly white as an estimate for snow pack. #Import the packages for images and arrays: import matplotlib.pyplot as plt import numpy as np ca = plt.imread('CaliforniaDrought_02232011_md.png') #Read in image countSnow = 0 #Number of pixels that are almost white t = 0.75 #Threshold for almost white-- can adjust between 0.0 and 1.0 #For every pixel: for i in range (ca.shape[0]): for j in range (ca.shape[1]): #check if red, green, and blue are > t: if (ca[i,j,0] > t) and (ca[i,j,1] > t) and (ca[i,j,2] > t): countSnow = countSnow + 1 print("Snow count is", countSnow) This program assumes that you have downloaded and saved CaliforniaDrought_02232011_md.png to the same directory as your program. How can you modify your program to let the user specify the input file? See Programming Problem ListStep by Step Solution
There are 3 Steps involved in it
Step: 1

Get Instant Access to Expert-Tailored Solutions
See step-by-step solutions with expert insights and AI powered tools for academic success
Step: 2

Step: 3

Ace Your Homework with AI
Get the answers you need in no time with our AI-driven, step-by-step assistance
Get Started


