

Question
Lab Assignment #3 In this assignment, you develop two purpose statements using the same data set (different purposes, same data) and will use regression and
Lab Assignment #3
In this assignment, you develop two purpose statements using the same data set (different purposes, same data) and will use regression and two sample hypotheses testing to analyze the same set of data. For example, you may want to determine if there is a relationship between the amount of space product to a product on shelves and sales volume. Your independent variable (the one that isn't changed by anything) is shelving space. Your dependent variable (the one that is changed by the independent variable) is sales volume. Using regression, you would hope to be able to conclude something similar to this: As shelving space increases, sales volume increases. Or, it could be worded the other way around. The point is there is a relationship, either positive or negative. Then, youll use regression or something similar to determine if the relationship is significant meaning that you can predict the results will be similar if tested in another environment and that your test wasnt a fluke! Youll do the same for the T-test, that is, you will split the data into two groups (you decide the groups and run a two sample T-test)
For this assignment:
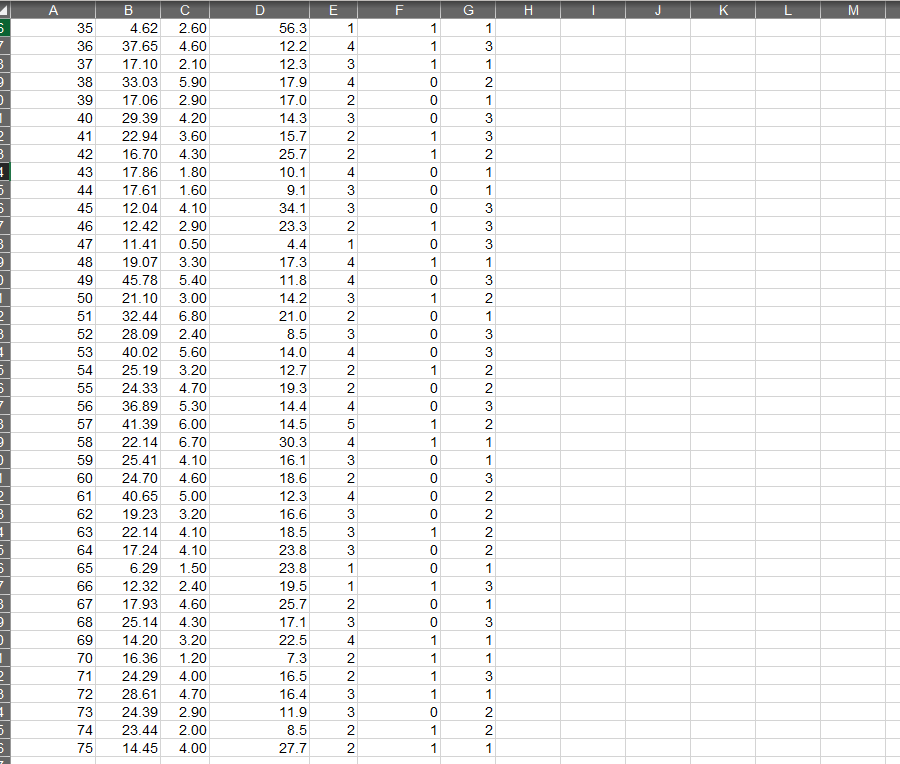
Use the TIPS dataset.
Develop two purpose statements (one suitable for regression analysis, and one suitable for a two-sample hypothesis test).
Develop two corresponding research questions for your purpose statements.
Develop two corresponding hypotheses for each research question.
For the report: first, you will provide an analysis, using MS Excel and statistical functions, on the data collected. Then, you will provide a write up to report your results, and give an interpretation of the results. Finally, you will provide conclusions and recommendations for further action based upon your findings.
Follow the Lab Assignment #3 Writing Template. Follow the step-by-step instructions and you will succeed. The writing template is to guide you, and allow you to use in your own real-world activities. This course, again, isn't designed to make you a statistician, but to show you how managers use analytics to make decisions.
Be sure to include a proper reference.
Important: You must use the TIPS dataset that I provided for your analysis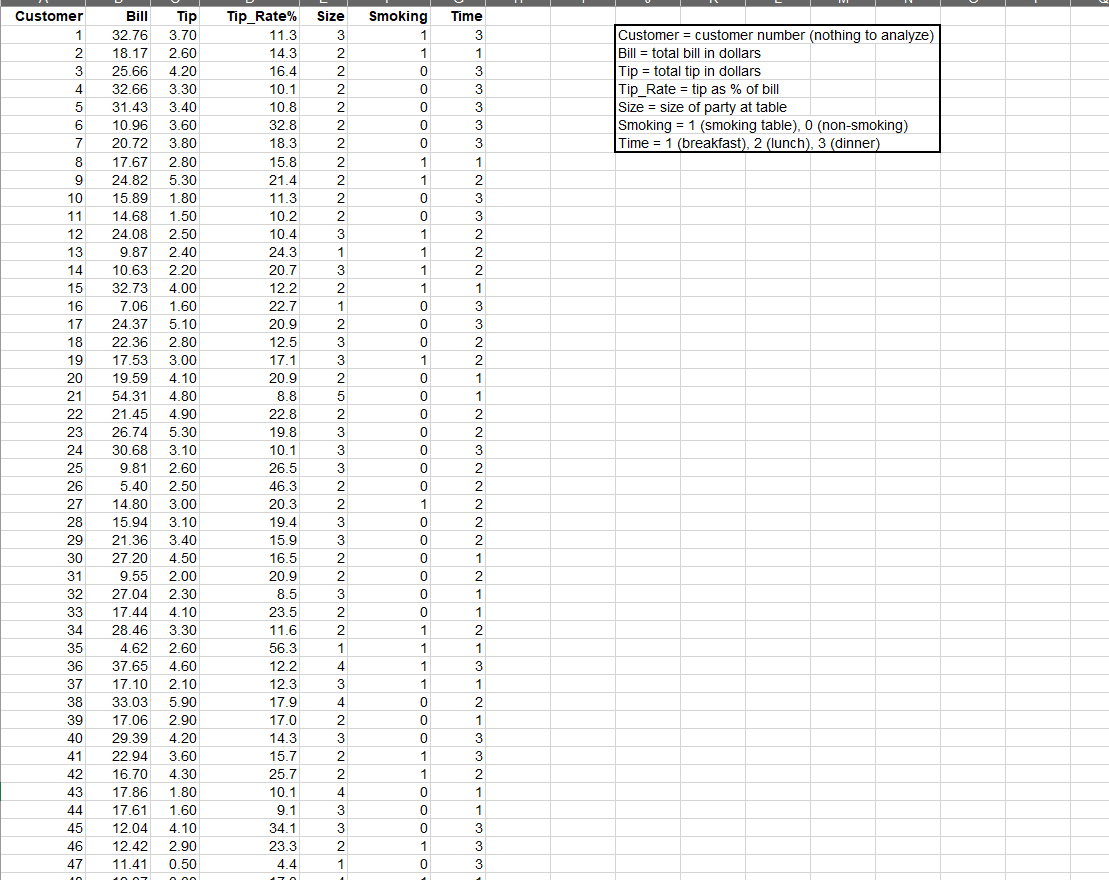
Step by Step Solution
There are 3 Steps involved in it
Step: 1

Get Instant Access to Expert-Tailored Solutions
See step-by-step solutions with expert insights and AI powered tools for academic success
Step: 2

Step: 3
Ace Your Homework with AI
Get the answers you need in no time with our AI-driven, step-by-step assistance
Get Started
Using Financial Accounting Information The Alternative to Debits and Credits
Authors: Gary A. Porter, Curtis L. Norton
7th Edition
978-0-538-4527, 0-538-45274-9, 978-1133161646