

Answered step by step
Verified Expert Solution
Question
1 Approved Answer
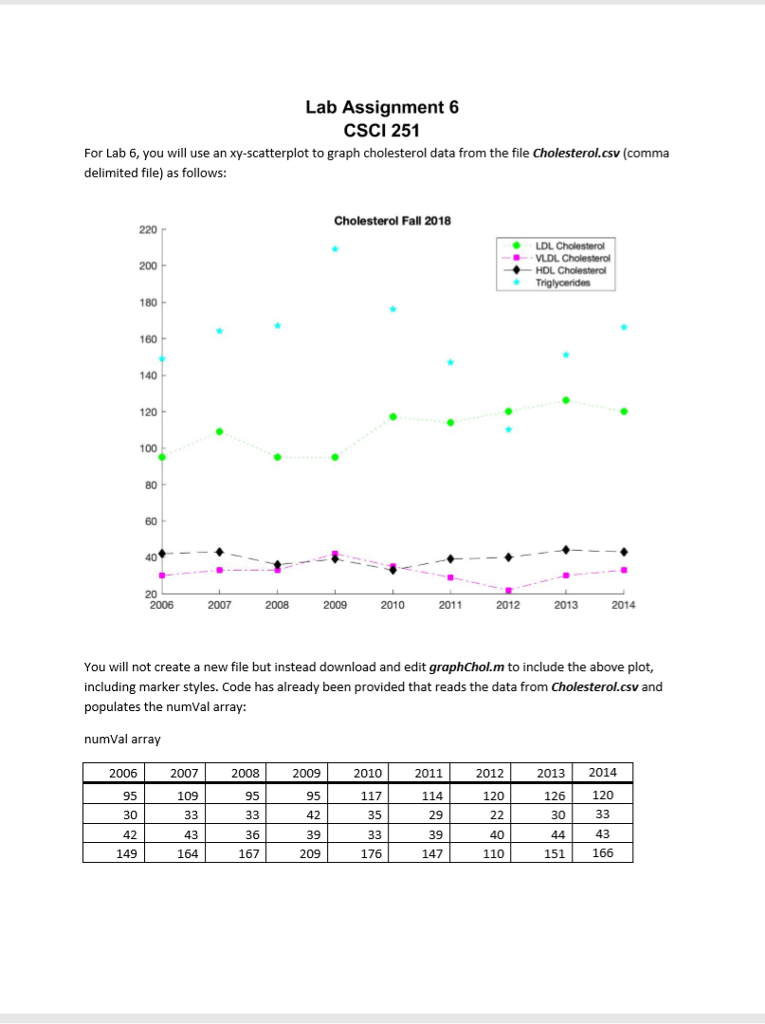
Lab Assignment 6 CSCI 251 For Lab 6, you will use an xy-scatterplot to graph cholesterol data from the file Cholesterol.csv(comma delimited file) as follows:
Step by Step Solution
There are 3 Steps involved in it
Step: 1

Get Instant Access to Expert-Tailored Solutions
See step-by-step solutions with expert insights and AI powered tools for academic success
Step: 2

Step: 3
Ace Your Homework with AI
Get the answers you need in no time with our AI-driven, step-by-step assistance
Get Started
Systems Analysis And Synthesis Bridging Computer Science And Information Technology
Authors: Barry Dwyer
1st Edition
0128054492, 9780128054499