Answered step by step
Verified Expert Solution
Question
1 Approved Answer
Lab Insight: Complete the Alt Lab by using steps similar to original Lab 4-3 in the text. Continue Working data file (Lab 4-3 Data). Add
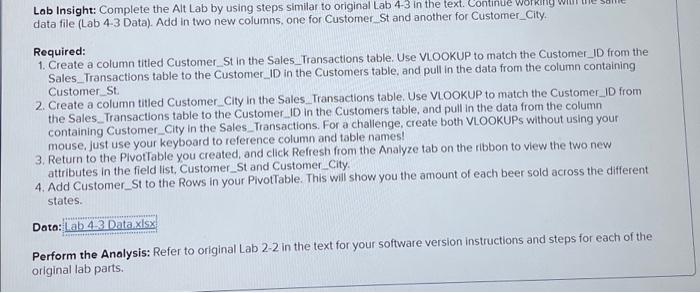
Lab Insight: Complete the Alt Lab by using steps similar to original Lab 4-3 in the text. Continue Working data file (Lab 4-3 Data). Add in two new columns, one for Customer_St and another for Customer_City. Required: 1. Create a column titled Customer_St in the Sales Transactions table. Use VLOOKUP to match the Customer_ID from the Sales Transactions table to the Customer_ID in the Customers table, and pull in the data from the column containing Customer_St. 2. Create a column titled Customer_City in the Sales Transactions table. Use VLOOKUP to match the Customer_ID from the Sales Transactions table to the Customer_ID in the Customers table, and pull in the data from the column containing Customer_City in the Sales Transactions. For a challenge, create both VLOOKUPS without using your mouse, just use your keyboard to reference column and table names! 3. Return to the PivotTable you created, and click Refresh from the Analyze tab on the ribbon to view the two new attributes in the field list, Customer_St and Customer_City. 4. Add Customer_St to the Rows in your PivotTable. This will show you the amount of each beer sold across the different states. Data: Lab 4-3 Data.xlsx Perform the Analysis: Refer to original Lab 2-2 in the text for your software version instructions and steps for each of the original lab parts.

Step by Step Solution
There are 3 Steps involved in it
Step: 1

Get Instant Access to Expert-Tailored Solutions
See step-by-step solutions with expert insights and AI powered tools for academic success
Step: 2

Step: 3

Ace Your Homework with AI
Get the answers you need in no time with our AI-driven, step-by-step assistance
Get Started


