Answered step by step
Verified Expert Solution
Question
1 Approved Answer
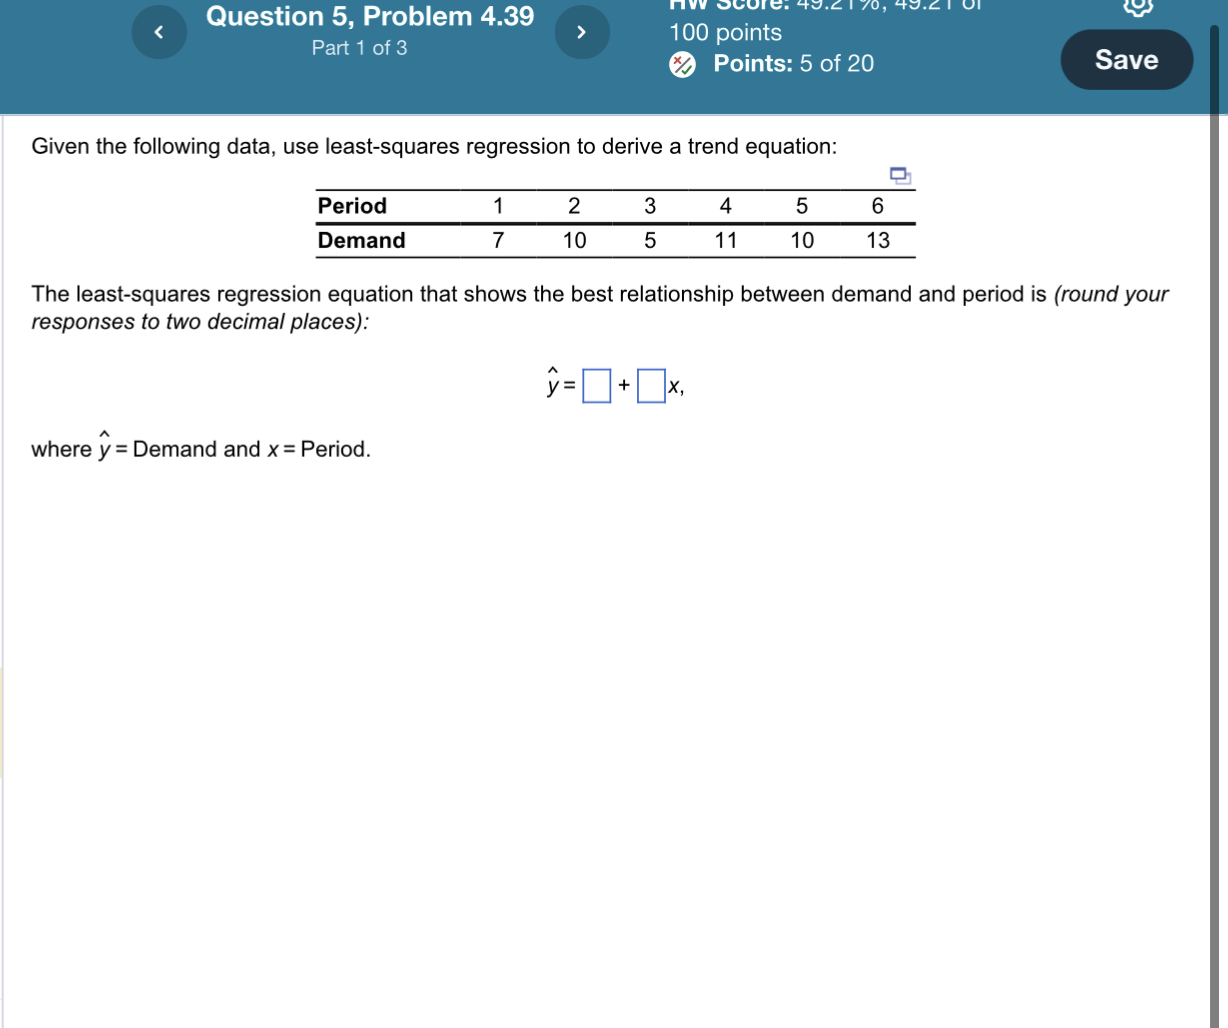
Label Each Part 1 through 3: Question 5, Problem 4.39 Part 1 of 3 100 points Points: 5 of 20 Given the following data, use
Label Each Part 1 through 3:
 Question 5, Problem 4.39 Part 1 of 3 100 points Points: 5 of 20 Given the following data, use least-squares regression to derive a trend equation: The least-squares regression equation that shows the best relationship between demand and period is (round your responses to two decimal places): y^=+x where y^= Demand and x= Period
 Step by Step Solution
There are 3 Steps involved in it
Step: 1

Get Instant Access to Expert-Tailored Solutions
See step-by-step solutions with expert insights and AI powered tools for academic success
Step: 2

Step: 3

Ace Your Homework with AI
Get the answers you need in no time with our AI-driven, step-by-step assistance
Get Started


