

Answered step by step
Verified Expert Solution
Question
1 Approved Answer
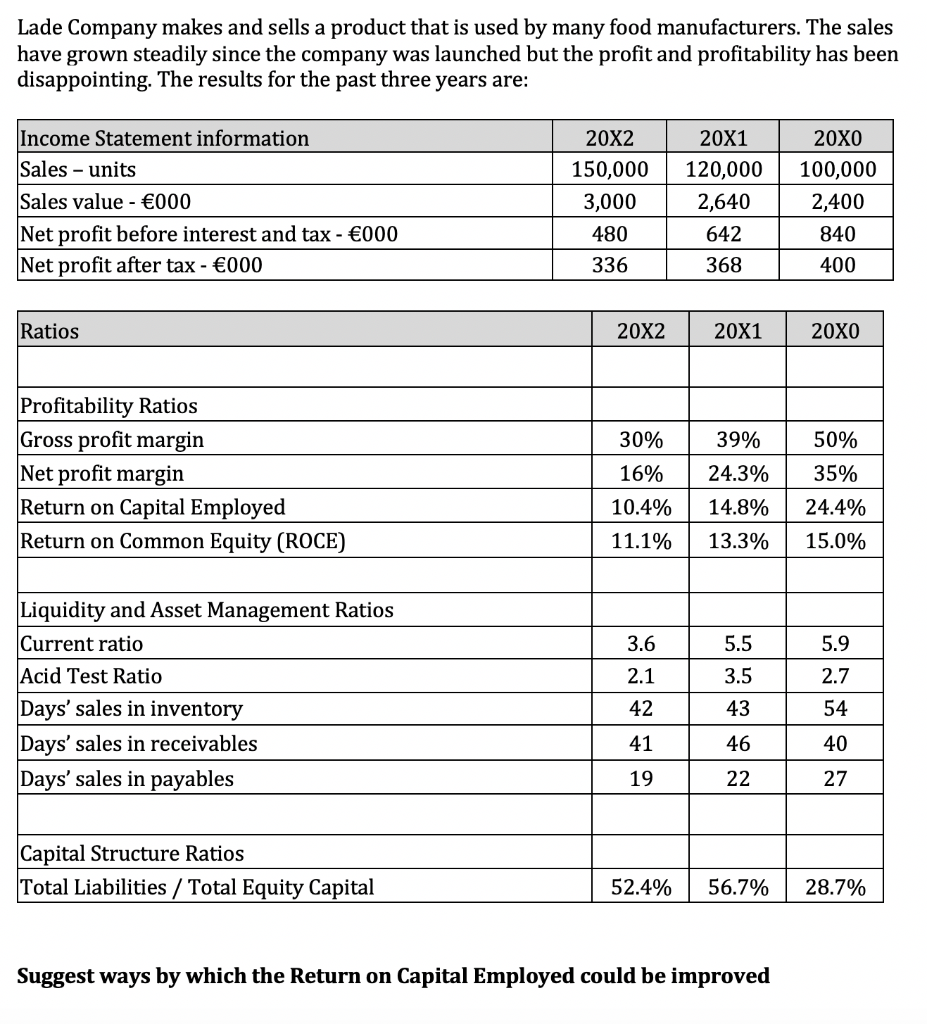
Lade Company makes and sells a product that is used by many food manufacturers. The sales have grown steadily since the company was launched but
Step by Step Solution
There are 3 Steps involved in it
Step: 1

Get Instant Access to Expert-Tailored Solutions
See step-by-step solutions with expert insights and AI powered tools for academic success
Step: 2

Step: 3
Ace Your Homework with AI
Get the answers you need in no time with our AI-driven, step-by-step assistance
Get Started
Islamic Theories Of Finance
Authors: Nicolas Aghnides
1st Edition
1593333110, 9781593333119